Graphics Reference
In-Depth Information
NDC Rectangular
Visible Volume
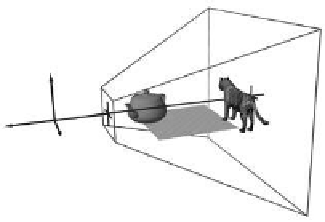
EC Visible Volume (Frustum)
Projection Transform
Y
Y
Z
Z
View frustum-to-NDC transform
.
Figure 14.20.
However, the
x
/
y
values of vertices are scaled according to their corresponding
z
-distance from the origin. Those that are farther away along the
z
-axis (from the
origin) are scaled down more so than those that are closer to the origin. For ex-
ample, pay attention to the checker floor. In EC space (left of
Figure 14.20
)
, the
floor is a rectangle where the teapot end is closer to the origin and the tiger end
is farther from the origin. After the transformation, in the NDC space (right of
Figure 14.20
)
, the rectangular floor has been transformed into a trapezoidal shape
with the tiger end being scaled smaller than the teapot end. We see that the pro-
jection transform performs disproportional scalings according to the
z
-distances
of objects. Besides the floor, we can further verify this disproportional scaling
by comparing the relative sizes of the tiger and the teapot. In the EC space, the
tiger is slightly larger. In the NDC space, because the tiger has a large
z
-distance,
it is scaled to be smaller than the teapot. Recall that we are transforming from
EC to NDC, and that in EC the eye position is located at the origin. By reducing
x
/
y
values of vertices in proportion to the corresponding
z
-distances, in fact, we
are simulating the foreshortening of human vision system where objects that are
farther away appear smaller.
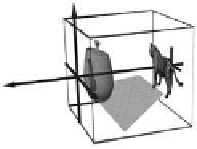
As will be discussed in the next section, the image in Figure 14.21 is computed
based on collapsing all objects in the NDC cube along the
z
-axis. In this image,
we can observe that the tiger is indeed slightly smaller than the teapot and that
the trapezoidal shape does convey a sense that the floor is parallel to our viewing
direction. The disproportional scaling of projection transform properly simulates
the foreshortening effect of the human vision system.
Just as the view transformation is defined by the WC-to-EC transformation
matrix (Equation (14.4)), the projection transform is also defined by a 4
Figure 14.21.
The im-
age generated by the cam-
era from Figure 14.20.
4ma-
trix. Because this transform is from EC to NDC, we refer to this matrix as the
M
e
2
n
matrix.
×


Search WWH ::

Custom Search