Graphics Programs Reference
In-Depth Information
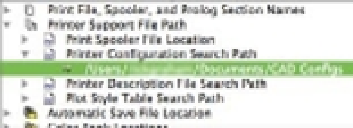
FIGURE 8.15
The printer con-
figuration search
path revised.
Understanding Plot Styles
To gain full control over the appearance of your output, you'll want to know about plot styles.
By using plot styles, you can control aspects of how the printer draws each object in a drawing.
If you don't use plot styles, your printer will produce output as close as possible to what you
see in the drawing editor, including colors. With plot styles, you can force all the colors to print
as black, and you can also assign a color to a fill pattern or a screen. This can be useful for charts
and maps that require area fills of different gradations. You can use multiple plot styles to pro-
duce prints that fit the exact requirements of your project.
I will show you firsthand how you can use plot styles to enhance your printer output. You'll
look at how to adjust the line weight of the walls in the Plan file and make color changes to your
printer output.
Choosing between Color-Dependent and Named Plot Style Tables
You can think of a plot style as a virtual pen that has the attributes of color, width, shape, and
screen percentage. A typical drawing may use several different line widths, so you use a different
plot style for each line width. Multiple plot styles are collected into
plot style tables
that allow you to
control a set of plot styles from one file. AutoCAD offers two types of plot styles: color and named.
Color plot style tables
(.ctb) enable you to assign plot styles to the individual AutoCAD colors.
For example, you can assign a plot style with a 0.50 mm width to the color red so that anything
that is red in your drawing is plotted with a line width of 0.50 mm. You can, in addition, set
the plot style's color to black so that everything that is red in your drawing is plotted in black.
AutoCAD's out-of-the-box setting is color plot style tables.
Named plot styles
(.stb) let you assign plot styles directly to objects in your drawing instead of
assigning them in a more general way through a color. Named plot styles also enable you to assign
plot styles directly to layers. For example, with named plot styles, you can assign a plot style that is
black and has a 0.50 mm width to a single circle or line in a drawing, regardless of its color.
Named plot styles are more flexible than color plot styles, but if you already have a library of
AutoCAD drawings set up for a specific set of printer settings, the color plot styles are a better
choice when you're opening files that were created in AutoCAD R14 and earlier. This is because
using color plot styles is more similar to the older method of assigning AutoCAD colors to plot-
ter pens. You may also want to use color plot style tables with files that you intend to share with
an individual or an office that is still using earlier versions of AutoCAD.
The type of plot style assigned to the new default Drawing1 depends on the value of the
PSTYLEPOLICY system variable.
Here's how to set up the plot style for new files:
1.
Choose File
Page Setup Manager from the menu bar. You can also press A-F-P. From
the Page Setup Manager palette, click the action menu and choose Edit.
2.
In the Page Setup - Layout1 dialog, select the Advanced button.