Geography Reference
In-Depth Information
Box 43.2
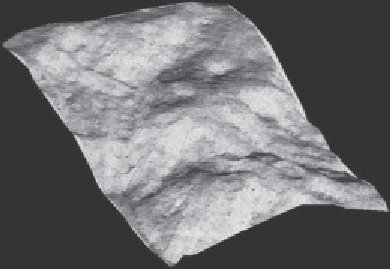
Model verification: using GPS to assess data quality of digital elevation models
Given the Influence of altitude and relief on the
characteristics of mountain environments, a high-quality
model of the topographical surface, a digital elevation
model (DEM) (Figure 43.4), forms the basis of the
successful development of computer-based modelling
tools for mountain environments (Stocks and Heywood
1994; Heller and Weibel 1991). However, the potential use
of readily available DEMs, often derived from national
mapping agency data, is limited by inadequate or
insufficient knowledge about the quality of these models.
The factors determining DEM data quality can be
classed under the two headings: digital elevation data
production and interpolation from these data to create
the DEM. Measures of digital elevation data accuracy
may be available. For example, the Ordnance Survey
(1996), the UK's national mapping agency, states that its
1:10,000-scale digital contour data has a root mean
squared error (RMSE) of 1.5 m. However, little is known
about the influence of the DEM generation process,
through data interpolation on the quality of the resulting
DEM. To provide this information, accurate altitude
measurements can be collected using GPS and
compared with altitude values derived from a DEM. To
test this approach, fieldwork was conducted in an area
of approximately 2 km
2
within the Snowdonia massif,
North Wales, UK. This area was chosen for its
accessibility, geological and geomorphological variety
and extremes of slope, aspect and relative relief.
The basis for the estimation of the quality of a DEM
was the collection of a sample of control points at
which elevation had been determined to a high order
of accuracy. GPS was used to collect these control
data because of its suitability for use in the more
inaccessible and data-poor areas of mountain
environments. Static DGPS-based measurements of
altitude and location were taken using carrier phase
observations. Magellan (1994) states that of sub-metre
accuracy data (±0.9 m) can be acquired with these
receivers. Field testing showed that such accuracy
positions were possible approximately 70 per cent of
the time, i.e. similar accuracies to those stated by
Magellan.
In the field, one receiver was used to collect data at a
known base station location. The second receiver was taken
to the sample points. At each sample point, 10 minutes of
GPS data were collected. For each sample point, the data
collected by the mobile receiver were differentially corrected
to provide estimates at sub-metre accuracy of the sample
points location and elevation. Position and elevation data
for 106 points within the Snowdon study area were
recorded. Points were chosen to provide a representative
sample of the area's varying terrain.
Digital contour data at 1:10 000 scale (RMSE=±1.5
m) were used to generate twenty-six DEMs of the study
area. Various combinations of different data patterns
(contour lines, random points, regular grids of points),
data densities, interpolation algorithms and interpolation
parameters were used to produce this range of DEMs.
The elevations at each of the sample point locations were
extracted for each DEM and compared with the
elevations from the GPS survey. The nature of the
resulting elevation error distributions was used to
describe the quality of each DEM. The mean elevation
error and the standard deviation of the elevation error for
each of the twenty-six DEMs was calculated. The
absolute mean error ranged from ± 3.12 to 7.11 m and
the standard deviation of the error from ± 3.77 to 10.32
m. Therefore, it is clear that the elevation accuracy of a
DEM varies considerably and depends on the pattern
and density of source data and the interpolation method
used. It is also apparent that the quality of the original
digital elevation data with a documented RMSE of ± 1.5
m gives little indication of the quality of the resultant DEM
(Carlisle and Heywood 1997).
Figure 43.4
Digital elevation model of Snowdonia, North
Wales
and georeferencing of spatial information (Box
43.3). The case studies described in the boxes also
show how a range of different GPS methods have
been used to provide positional information. The
examples are from Snowdonia, Wales, and Nepal
and look at geomorphological mapping using
kinematic DGPS (Box 43.1); the verification of
the quality of data provided by digital elevation
models (DEMs) (Box 43.2); and the use of GPS to
assist mapping of forest resources (Box 43.3). In
the Nepal case study, GPS was used to help the
local population to map the forest resource for use
in local management strategies. This example
illustrates how GPS can be used not only for
geographical research but also for more pragmatic
and practical applications.