Geography Reference
In-Depth Information
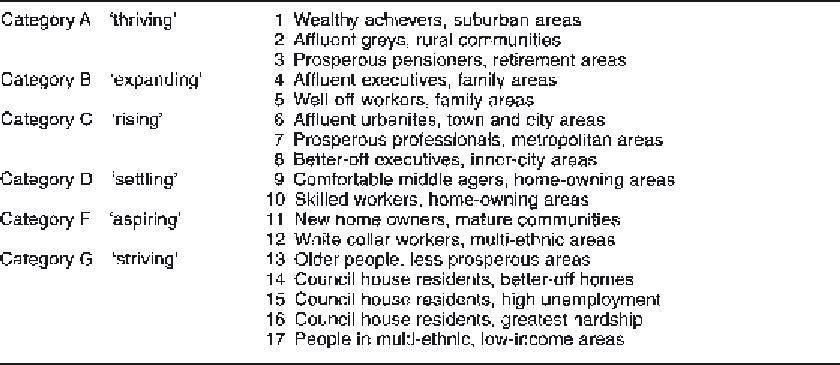
Table 42.2
ACORN geodemographic classification.
Lifestyle data is information collected about
individual households through the use of self-
completed questionnaires. Since the data are
collected at the household level, this avoids the
problem encountered by using census data, namely
the fact that data are available only at an aggregate
level. Using lifestyle data, it is possible to identify
the number of households that have specific
combinations of characteristics such as 'Volvo-
owning golfers with an interest in fine wine'. A
good example of the use of lifestyle data comes
from the UK wine merchants known as 'Bottoms-
up'. They have identified their main target group
not as a single age or single social-class group but
as persons with a special type of lifestyle. They call
these persons 'serious piss artists' —a crude
terminology for persons 25-40 with higher
incomes who spend most of their drinking and
socialising time now at home, so are usually
married persons with young families and hence
may have less time or opportunity to visit the pub
(see Belchamber 1997). A further example is
provided in Box 42.1.
It is probably true that lifestyle data offers a
more precise way of targeting particular customer
groups, as well as being a more powerful tool for
direct marketing. Its main drawback, however, is
that it is not a complete census of the UK
population and has under- and over-
representation of some consumer groups.
However, the largest lifestyle database (collated by
NDLI) contains over 10 million households,
nearly 50 per cent of the UK total. These systems
are set to have a large impact on geodemographic
marketing tools in the next century.
GIS packages have increasingly been used in
retail site assessment research to supplement
geodemographic analysis. They first allow
information relating to stores or shopping
centres, and the populations within their
catchment areas, to be
geocoded
(that is, placed on
the computer with a spatial referencing point)
and visually
displayed
through maps and graphs.
Once the information is stored in the computer,
the user can then attempt to estimate store
revenues. Take, for example, the problem of
predicting the revenue of a new grocery store.
The GIS enables the user to
buffer
(or demarcate)
travel times around the new store and then
calculate the population within each time band
using the standard
overlay
procedure available in
most GIS packages (see Beaumont 1991a, b;
Howe 1991; Elliot 1991; Ireland 1994). An
example of this will be given in the next section.
Once an estimate has been made concerning the
demand within the likely buffered areas, then a
variety of methods may be used to translate these
population totals into estimates of individual