Geography Reference
In-Depth Information
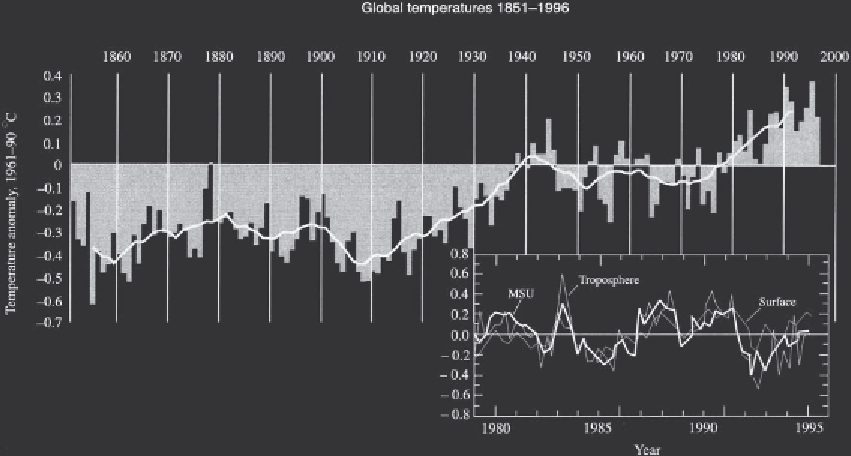
Figure 2.4
Changes in global average surface air temperature over land and sea (1851-1996) relative to the averaging
period 1961-90. The solid curve represents the ten-year RM plotted mid-period. Inset: Comparison of globally averaged
temperatures shown as departures from the 1979-94 average for (a) the MSU (Microwave Sounding Unit) channel of
the NOAA meteorological satellites sensing temperature in the lower to mid-troposphere—1-10 km altitude (bold line);
(b) radiosonde measurements in the troposphere (thin line); (c) surface air temperature data (dashed line).
Source:
Houghton1997.
Regional data sets
Regional collections of temperature data are still
important, particularly those that have been
compiled with some quality control such as that
assembled for central England by Gordon Manley
and subsequently extended by the UK
Meteorological Office (Jones and Hulme 1997).
Ensembles of non-gridded data for other parts of
the world have also been produced (Hulme
et al
.
1994), usually with some adjustment for urban
heat island effects. Regional time series may also
be gridded into boxes, typically 20° latitude×60°
longitude. These show considerable regional
variability but also reveal coherent trends between
adjacent areas within the same hemisphere (IPCC
1990: pp. 214-5). The published results indicate
that moderate cooling (-0.4°C) took place in the
Northern Hemisphere in the two decades after
1950, especially in the western sector (0-180° W).
Although not shown on the graph, 1997 was
the warmest year to date. The correlation of this
record with that of the steady rise in CO
2
(see
Figure 2.1) is only approximate. It implies that
the climate system is responding in a complex
way to direct radiative forcing through
increased CO
2
.
Over a shorter time scale, Houghton (1997)
has provided an interesting comparison of global
seasonal temperature anomalies from three
different sources—satellites (MSU), radiosondes
(from Parker and Cox 1995) and surface air
temperatures (see Figure 2.4, inset). While
complete agreement could not be expected, the
sign of the anomaly (+/-) is similar. For example,
each data set shows global cooling, chiefly in
1992, which was associated with the Mount
Pinatubo volcanic eruption in the Philippines in
1991.