Geography Reference
In-Depth Information
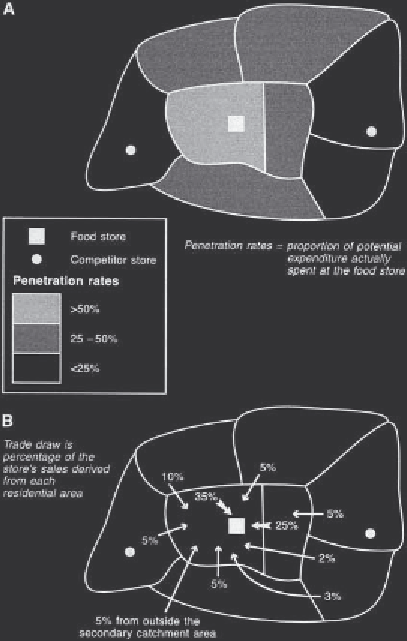
Figure 33.4
(A) Market penetration rates, and (B) trade
draw pattern, for a large food store.
Figure 33.5
Estimating sales in a new large food store
using a spatial interaction model.
Source:
Based on Doidge 1995, Figure 3.
Broom (1988) describe the method used at that
time by the food retailer Tesco in calculating the
probable volume of sales for a proposed store.
This is summarised in Figure 33.5. Many other
companies, especially in North America,
routinely use similar methods. As with market
area analysis, these methods make heavy use of
analysis of existing store sales and catchment
population records. The recent tendency for food
retailers to issue
loyalty cards
to customers is aimed
partly at establishing a reliable and
comprehensive database that associates
expenditure patterns in particular stores with
shoppers' residential addresses and information
about their family composition (Clarkson
et al
.
1996).
Methods similar to these can be extended to
deal with other, more complex, problems such as
the forecasting of sales for a new shopping centre.
Some retail companies carry out a performance
evaluation for existing outlets through making
sales forecasts using market analytical or modelling
methods. These forecasts are then compared with
actual sales (Davies 1977). An examination of the
values of residuals between forecast and actual sales
may be used either to improve the forecasting
method or to identify strengths and weaknesses
within the existing store portfolio.