Geography Reference
In-Depth Information
Western European society on the variation in
water quality between urban and rural areas, the
relative importance of different types and sources
of contamination and the changes in pollution
status over recent decades. Rivers and canals in
England and Wales are currently classified under
the General Quality Assessment Chemical scheme,
which is based on measurements of dissolved
oxygen, biochemical oxygen demand and
ammonia over a three-year period, into six
categories from very good (Class A) to bad (Class
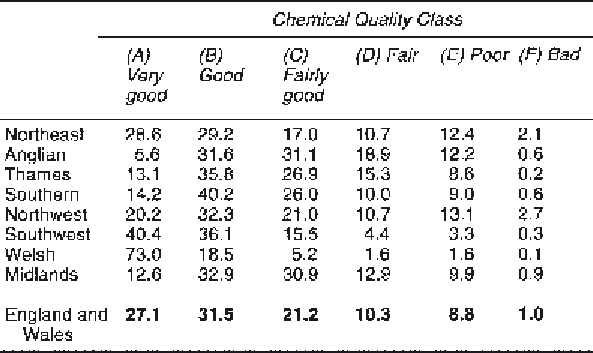
F). Results for the period 1994-96 show that for
England and Wales as a whole almost 60 per cent
of the rivers had a chemical quality that was good
or very good, whereas nearly 10 per cent of the
watercourses were classified as poor or bad (Table
11.6). National averages, however, obscure
significant regional contrasts in water quality
within England and Wales. The highest proportion
of very good and good quality rivers are found in
the predominantly upland, less intensively farmed
and high-runoff areas of Wales and the southwest,
whereas the highest percentages of poor and bad
quality reaches are encountered in the
industrialised regions of the northwest and
northeast (Table 11.6). Rivers tend to be
dominated by fairly good or fair chemical quality
in the intensively farmed and low-runoff Anglian
region, and in the heavily populated Midlands and
Thames regions (Table 11.6).
Environment Agency records show that the
total number of reported pollution incidents in
England and Wales has risen from around 13,000
in the early 1980s to over 30,000 in the late 1990s
(Figure 11.5A). This rise, to a certain extent,
reflects an increased public awareness of water
quality issues. Furthermore, many of the incidents
are relatively minor and cannot subsequently be
substantiated, and the proportion of reports where
no pollution could be found on further
investigation has risen from around 25 per cent in
the early 1990s to over 35 per cent in 1996 and
1997 (Figure 11.5A). Substantiated incidents are
classified into three categories depending on their
severity (Table 11.7). Analysis of all substantiated
incidents in 1997 by type of pollution (Figure
11.5B) showed that the most common
contaminants were oil and sewage, whereas
organic wastes, mainly in the form of cattle slurry,
chemicals from paints and dyes, and silt were each
responsible for less than 10 per cent of the
incidents. However, for major (Category 1)
incidents sewage was less important than
contamination by oil or chemicals (Figure 11.5B).
Table 11.6
Percentage length of rivers in different chemical quality classes in
England and Wales and regions, 1994-6.
Source:
Environment Agency 1997a.