Chemistry Reference
In-Depth Information
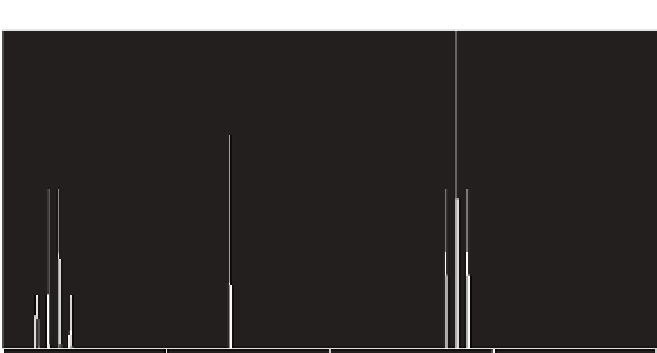
Ethanol
700
H
H
H
CCOH
H
600
H
500
H
H
400
H
300
200
100
0
4
3
2
1
0
-100
FIGURE 3.1
1
H NMR spectrum of ethanol.
molecule there are three distinct types of hydrogen: three on one carbon, two on
another, and the proton of the OH group. The chemical shifts are different and pos-
sess unique positions in the NMR spectrum. The proton signals are observed as
multiple peaks due to the “splitting” by the corresponding adjoining protons. In this
example, the CH
3
protons are observed as a triplet and the CH
2
group as a quartet.
The OH proton is not affected by any adjoining proton and remains as a singlet.
3.2 ULTRAVIOLET AND INFRARED SPECTROSCOPY
Ultraviolet (UV) light is electromagnetic radiation with a wavelength shorter than
that of visible light but longer than X-rays, in the range 10 to 400 nm, but the fre-
quencies are invisible to humans. In chemical analysis and for separations, the use of
a UV or photodiode array (PDA) detector based on detection of the molecule's UV
spectrum is a useful tool. In particular, phenolic compounds and conjugated systems
possess strong, easily characterized chromophores. Examples of UV spectra of dis-
tinctive chromophores of select carotenoids are shown in Chapter 11.
Infrared (IR) spectroscopy (Figure 3.2) measures the infrared region of the elec-
tromagnetic spectrum light with a longer wavelength and lower frequency than vis-
ible light.
Examples of intense IR stretches in the region of 1660-1780 cm
-1
characterize
various C=O stretching bands. Examples of molecules possessing these characteris-
tics are the β-lactam antibiotics described in Chapter 9.
3.3 MASS SPECTROMETRY
Mass spectrometers are used to measure the difference in mass-to-charge ratio
(m/z or m/e) of ionized atoms, molecules, and fragment ions. These charged ions


Search WWH ::

Custom Search