Environmental Engineering Reference
In-Depth Information
Table 2.9
Latitude
ϕ
and Longitude
λ
of Selected Locations
Bergen
Berlin
London
Rome
LA
Cairo
Bombay
Upington Sydney
ϕ
60.40°
52.47°
51.52°
41.80°
33.93° 30.08°
19.12°
-28.40°
-33.95
λ
5.32°
13.30°
-0.11°
12.58°-118.40° 31.28°
72.85°
21.27°
151.18°
Table 2.9 shows angles of latitude and longitude for selected locations.
Other algorithms such as the SUNAE algorithm (Walraven, 1978;
Wilkinson, 1981; Kambezidis and Papanikolaou, 1990) or the NREL SOLPOS
algorithm (NREL, 2000) have improved accuracies, mainly at low solar
altitudes. These algorithms include the refraction of the beam irradiance by
the atmosphere. However, they are also much more complex than the
algorithm described above. The CD-ROM of the topic contains the code for
these algorithms.
Solar position
or
sun-path diagrams
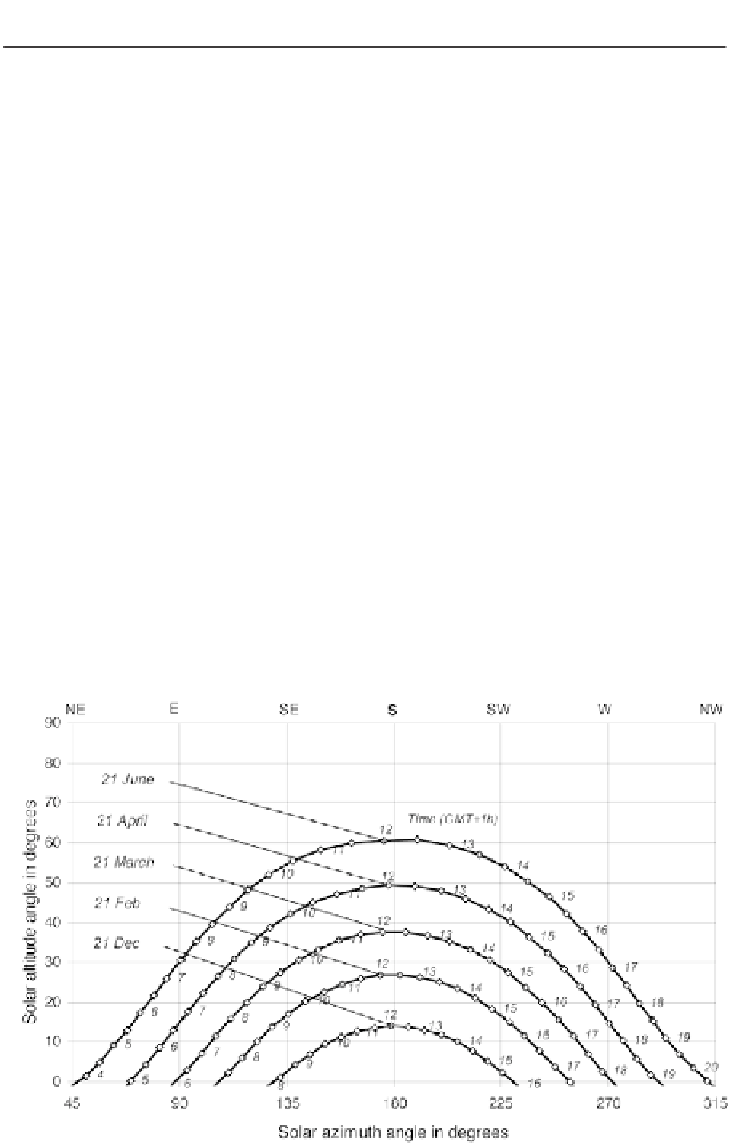
are used to visualize the path of the
sun in the course of a day. These diagrams show sun height and azimuth for
every hour of the selected days with a curve drawn through the points. Figure
2.11 shows the solar position diagram for Berlin and Figure 2.12 that for
Cairo. For clarity, these diagrams show only five months from the first half of
the year; the corresponding months for the second half of the year have nearly
symmetrical curves.
Solar position diagrams for southern latitudes look similar, except that the
south position is in the centre of the diagram instead of north. Solar position
diagrams for locations between the northern and southern tropics are different
in that the sun is in the south at solar noon for some months and in the north
for others.
Figure 2.11
Solar Position Diagram for Berlin, Germany (52.5°N)