Environmental Engineering Reference
In-Depth Information
Table 5.5
Density of Air as a Function of the Temperature,
p
= 1 bar = 1 hPa
ϑ
Temperature
in °C
-20
-10
0
10
20
30
40
ρ
Density
in kg/m
3
1.377
1.324
1.275
1.230
1.188
1.149
1.112
Source:
data from VDI, 1993
(5.12)
The density of air
. The
density changes proportionally to the air pressure at constant temperature.
Table 5.5 shows the density change for different temperatures at constant
pressure.
Wind during a violent storm of Beaufort force 11 and a speed of 30 m/s at
a temperature of 10°C reaches a power of 16.6 kW/m
2
. With these high power
densities, the devastation caused by violent storms is no surprise. However, the
power of wind with a speed of 1 m/s is less than 1 W/m
2
. Therefore, high mean
wind speeds are essential for a good yield from a wind generator.
For the
utilization of wind power
a technical system such as a wind turbine
should take as much power from the wind as possible. This turbine slows the
wind from speed
v
1
to speed
v
2
and uses the corresponding power difference.
If this happened in a pipe with rigid walls at constant pressure, the wind speed
v
2
would change with the initial wind speed
v
1
, because the same amount of
air that enters the pipe must leave it. Hence, the mass flow of the air before
and after the wind turbine is the same.
Wind turbines slow down the wind when converting wind energy into
electricity; however, the mass flow before and after the wind turbine remains
constant. The wind flows through a larger cross-section after passing through
the wind turbine as shown in Figure 5.4. For constant pressure and density
ρ
varies with the air pressure
p
and temperature
ϑ
ρ
of the air, the mass flow is:
(5.13)
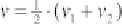
The wind speed
(5.14)
at the height of the wind turbine is the average of the wind speeds
v
1
and
v
2
.
The power
P
T
taken from the wind can be calculated from the difference in
wind speeds:
.
(5.15)
With
m
•
=
ρ
•
A
•
v
=
ρ
•
A
•
_
2
•
(
v
1
+
v
2
), the expression becomes: