Biology Reference
In-Depth Information
Table 1. Details of buoy-based long-term acoustic observation deployed at Station C (see
Figure 1), and total porpoise detection duration (min) and presence ratio (%) during
each deploying period.
Start day
End day
Days
Porpoise detection duration (min)
Presence ratio (%)
Jun. 27
Jul. 25
29
7,727
19.4
Jul. 26
Aug. 28
34
3,148
6.6
Sep. 12
Sep. 28
17
4,536
19.5
Total
80
15,411
13.9
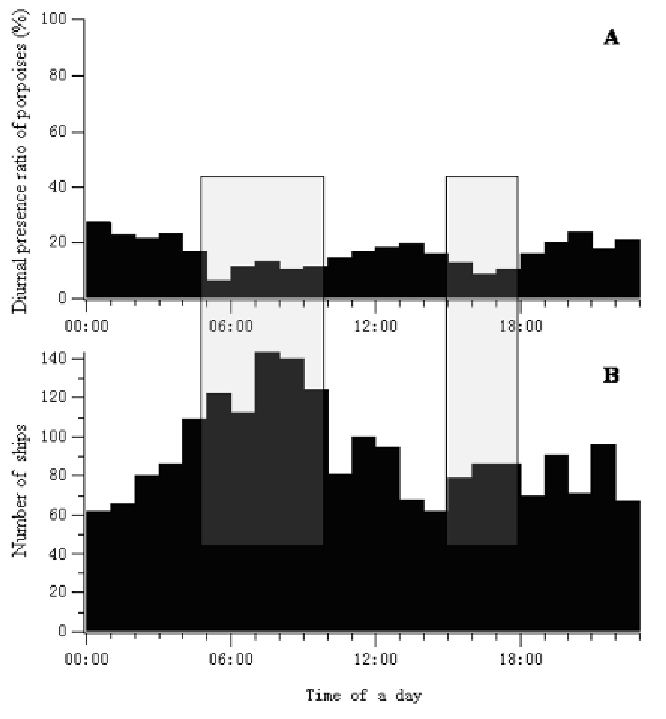
Figure 5. (a) The diurnal presence ratio of porpoises detected by the A-tag in each 1-hour time unit over
the entire observation period at Station C. (b) The number of ships detected by the A-tag in each 1-hour
time unit over the entire observation period at Station C. Matches between hollows of porpoise
presence ratio and ridges of ship number, are indicated by grey transparent panes.


Search WWH ::

Custom Search