Biology Reference
In-Depth Information
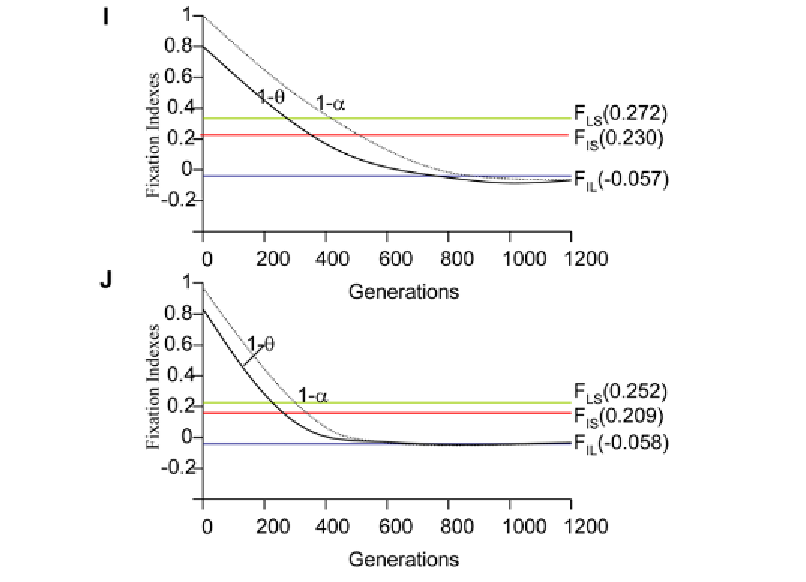
Figure 2. The first ten simulations (A, B, C, D, E, F, G, H, I, J) carried out with the Chesser's model to
determine asymptotic F values (F
LS
, F
IL
, F
IS
) for the pink river dolphin populations studied in the Napo-
Curaray Rivers at the Peruvian Amazon. Different
s
,
n
,
m
,
b
,
g
,
d
m
and
d
f
variable values were
employed in the simulations to obtain asymptotic F values virtually identical to the real F values
observed among the eight pink river dolphin populations studied.
of heterozygote was lower than that observed (F
IL
). (G) When the simulation values were s =
8, n = 7, m = 2, b = 2, and g = 1250 (and migration rates, for males d
m
= 0.1, and for females
d
f
= 0) the simulation yielded the asymptotic F-statistic values F
LS
= 0.25011, F
IL
= -0.01478,
and F
IS
= 0.23902. The F
LS
value was almost identical to the real value obtained. The F
IS
value was relatively similar to the real one, but the excess of heterozygote was lower than that
observed (F
IL
). These small changes were motivated by reducing one reproductive female in
each lineage. Simulation H used the values s = 8, n = 7, m = 2, b = 3.5, and g = 1250 (and the
migration rates, for males d
m
= 0.2, and for females d
f
= 0). With these values, this simulation
yielded the following asymptotic F-statistic values: F
LS
= 0.23248, F
IL
= -0.04375, F
IS
=
0.19891. The agreement between the simulated and the real data begin to be very high. For
simulation I, the values were: s = 8, n = 7, m = 1, b = 4, and g = 1250 (and the migration
rates, for males d
m
= 0.2, and for females d
f
= 0). With these values, this simulation yielded
the following asymptotic F-statistic values: F
LS
= 0.27232, F
IL
= -0.05771, F
IS
= 0.23032. The
agreement between the simulated and the real data was again very high. In simulation J, the
values were: s = 8, n = 7, m = 1, b = 4, and g = 1250 (and the migration rates, for males d
m
=
0.22, and for females d
f
= 0). With these values, this simulation yielded the following
asymptotic F-statistic values: F
LS
= 0.25293, F
IL
= -0.05780, F
IS
= 0.20975. These simulated
F-statistics were virtually identical to the real ones. It is noteworthy to mention that in this

Search WWH ::

Custom Search