Biomedical Engineering Reference
In-Depth Information
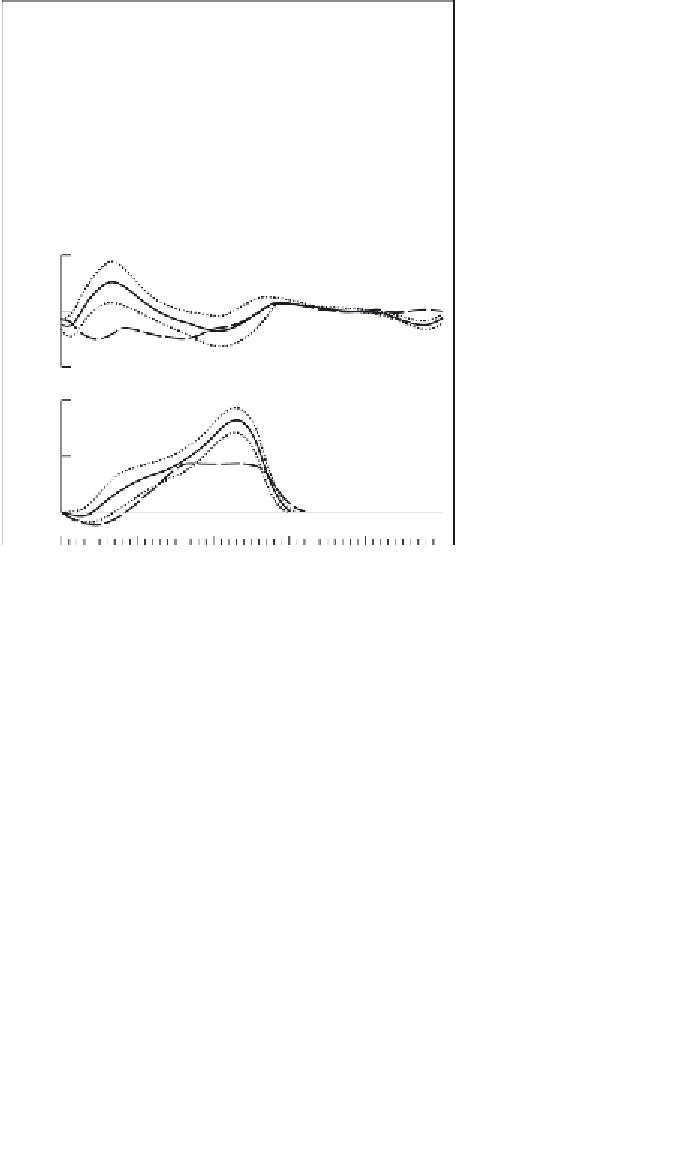
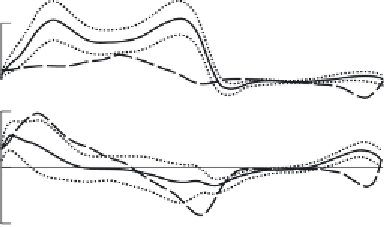
MOMENT OF FORCE (WP30A vs NORMALS)
1
SUPPORT
0
1
HIP
0
−
1
1
KNEE
0
−
1
NORMALS (N
=
29)
2
Std.Dev.
WP30A
1
ANKLE
0
% OF STRIDE
Figure 2.20
Moment-of-force profiles of an above-knee amputee (dashed lines) over-
laid on the ensemble-averaged profiles for 29 young adults. The averaged profiles are
solid lines with dotted lines representing
one standard deviation. To reduce the vari-
ability of these intersubject moment curves, the joint moments were divided by body
mass prior to averaging. (Reproduced with permission from Winter, D.A.
Biomechanics
and Motor Control of Human Gait: Normal, Elderly and Pathological, 2
nd
±
Ed
. Waterloo
Biomechanics, 1995.)
lines representing
±
one standard deviation. The units of these intersubject
moment-of-force curves are N.m/kg; dividing by body mass was necessary to
decrease the variability by about 50%. Also noted is that the cyclical period
of one stride has been normalized to 100%. Thus, the process to create these
averaged waveforms requires the time base of each subject's profiles to be
altered from their individual stride time (in sec) to a 100% stride baseline.
2.3.2 Normalization of Time Bases to 100%
Assume that for one subject there are
n
samples of a given variable
x
over
the stride period and we wish to normalize this time-domain record to
N


Search WWH ::

Custom Search