Biomedical Engineering Reference
In-Depth Information
(
a
)
(
b
)
(
c
)
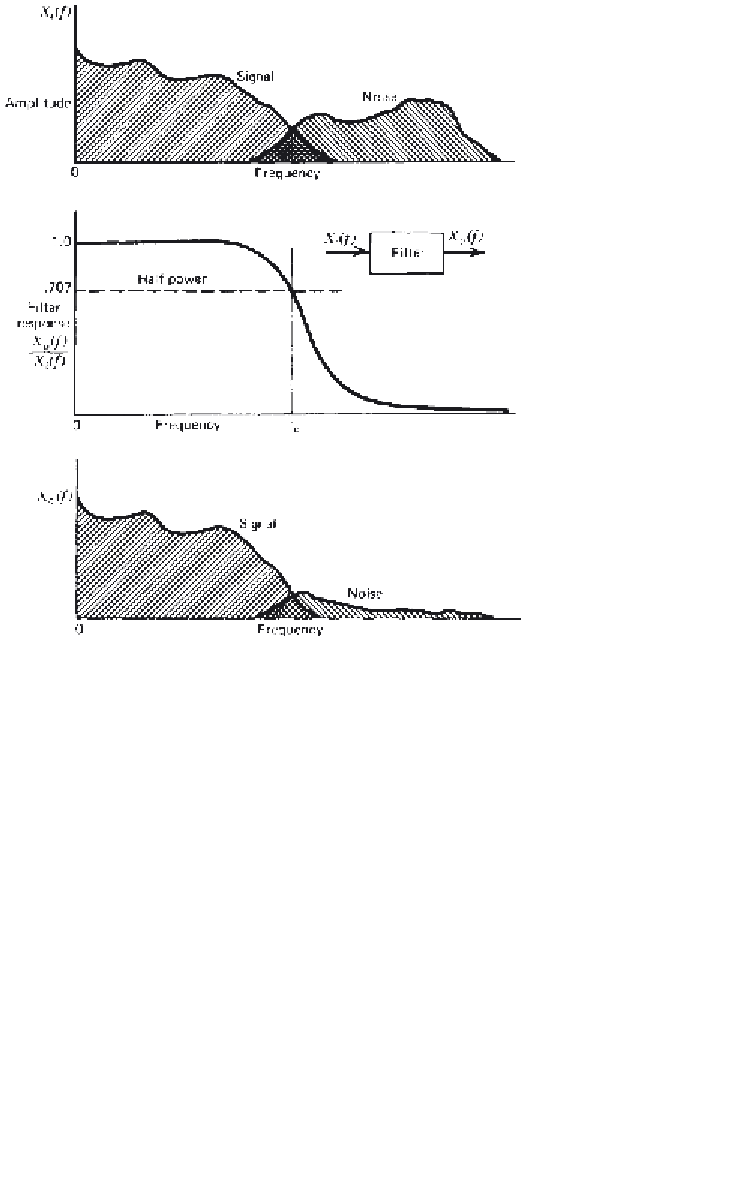
Figure 2.16
(
a
) Hypothetical frequency spectrum of a waveform consisting of a
desired signal and unwanted higher-frequency noise. (
b
) Response of low-pass filter
X
o
(f )/X
i
(f )
, introduced to attenuate the noise. (
c
) Spectrum of the output waveform,
obtained by multiplying the amplitude of the input by the filter response at each fre-
quency. Higher-frequency noise is severely attenuated, while the signal is passed with
only minor distortion in transition region around
f
c
.
that are not the result of the process itself (in this case, walking). Noise
comes from many sources: electronic noise in optoelectric devices, spatial
precision of the TV scan or film digitizing system, and human error in film
digitizing. If the total effect of all these errors is random, then the true signal
will have an added random component. Usually, the random component is
high frequency, as is borne out in Figure 2.17. Here, we see evidence of
higher-frequency components extending up to the 20th harmonic, which was
the highest frequency analyzed. The presence of the higher-frequency noise
is of considerable importance when we consider the problem of trying to


Search WWH ::

Custom Search