Biomedical Engineering Reference
In-Depth Information
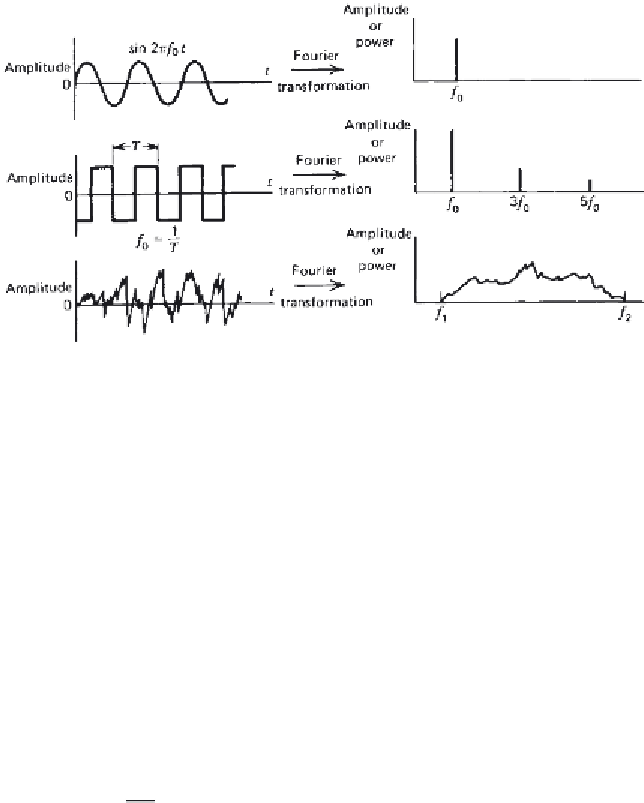
Figure 2.10
Relationship between a signal as seen in the time domain and its equiv-
alent in the frequency domain.
of the fundamental frequency
f
0
. These higher frequencies are called
harmon-
ics
. The third harmonic is 3
f
0
, and the tenth harmonic is 10
f
0
. Any perfectly
periodic signal can be broken down into its harmonic components. The sum
of the proper amplitudes of these harmonics is called a
Fourier series
.
Thus, a given signal
V (t )
can be expressed as:
V (t )
=
V
dc
+
V
1
sin (
ω
0
t
+
θ
1
)
+
V
2
sin (2
ω
0
t
+
θ
2
)
+···
+
V
n
sin (
nω
0
t
+
θ
n
)
(2.10)
where
ω
0
=
2
π f
0
, and
θ
n
is the phase angle of the
n
th harmonic.
For example, a square wave of amplitude
V
can be described by the Fourier
series of odd harmonics:
sin
ω
0
t
4
V
π
1
3
sin 3
ω
0
t
1
5
sin 5
ω
0
t
V (t )
=
+
+
+···
(2.11)
A triangular wave of duration 2
t
and repeating itself every
T
seconds is:
1
2
+
2
π
2
2
2
Vt
T
2
3
π
V (t )
=
cos
ω
0
t
+
cos 3
ω
0
t
+···
(2.12)
Several names are given to the graph showing these frequency components:
spectral plots, harmonic plots
, and
spectral density functions
. Each shows the
amplitude or power of each frequency component plotted against frequency;
the mathematical process to accomplish this is called a
Fourier transformation


Search WWH ::

Custom Search