Biomedical Engineering Reference
In-Depth Information
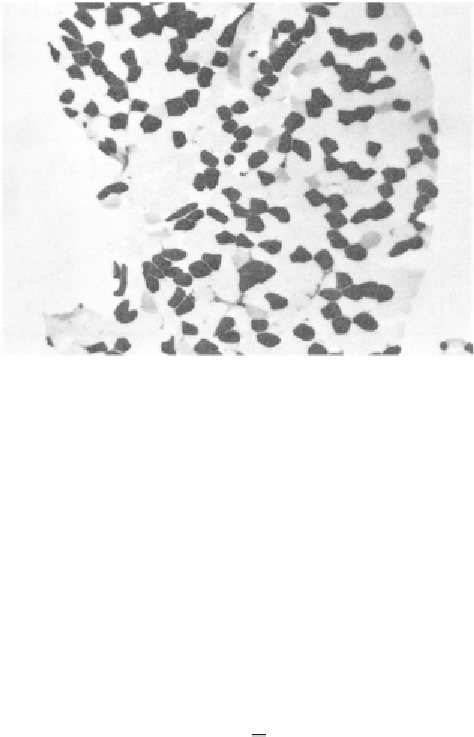
Figure 9.4
Histochemical stain showing dark slow-twitch fibers and light fast-twitch
fibers. A myofibrillar ATPase stain, pH 4.3, was used to stain the vastus lateralis of
a female volleyball player. (Reproduced by permission of Professor J. A. Thomson,
University of Waterloo, Waterloo, Ont., Canada.)
motor unit has its unique time course of tension. Although there are individ-
ual differences in each newly recruited motor unit, they all have the same
characteristic shape. The time-course curve follows quite closely that of the
impulse response of a critically damped second-order system (Milner-Brown
et al., 1973
a
). The electrical stimulus of a motor unit, as indicated by this
action potential, is of short duration and can be considered an impulse. The
mechanical response to this impulse is the much longer duration twitch. The
general expression for a second-order critically damped impulse response is
t
T
e
−
t /T
F (t )
=
F
0
(9.1)
For the curve plotted in Figure 9.5, the twitch time,
T
, is the time for
the tension to reach a maximum, and
F
0
is a constant for that given motor
unit.
T
is the contraction time and is larger for the slow-twitch fibers than
for the fast-twitch motor units, while
F
0
increases for the larger fast-twitch
units. Muscles tested by Buchthal and Schmalbruch (1970) using submaximal
stimulations showed a wide range of contraction times. Muscles of the upper
limbs generally had short
T
values compared with the leg muscles. Typical
mean values of
T
and their range were:
Triceps brachii
44.5 ms (16 -68 ms)
Biceps brachii
52.0 ms (16 -85 ms)
Tibialis anterior
58.0 ms (38 -80 ms)
Soleus
74.0 ms (52 -100 ms)
Medial gastrocnemius
79.0 ms (40 -110 ms)


Search WWH ::

Custom Search