Graphics Reference
In-Depth Information
y
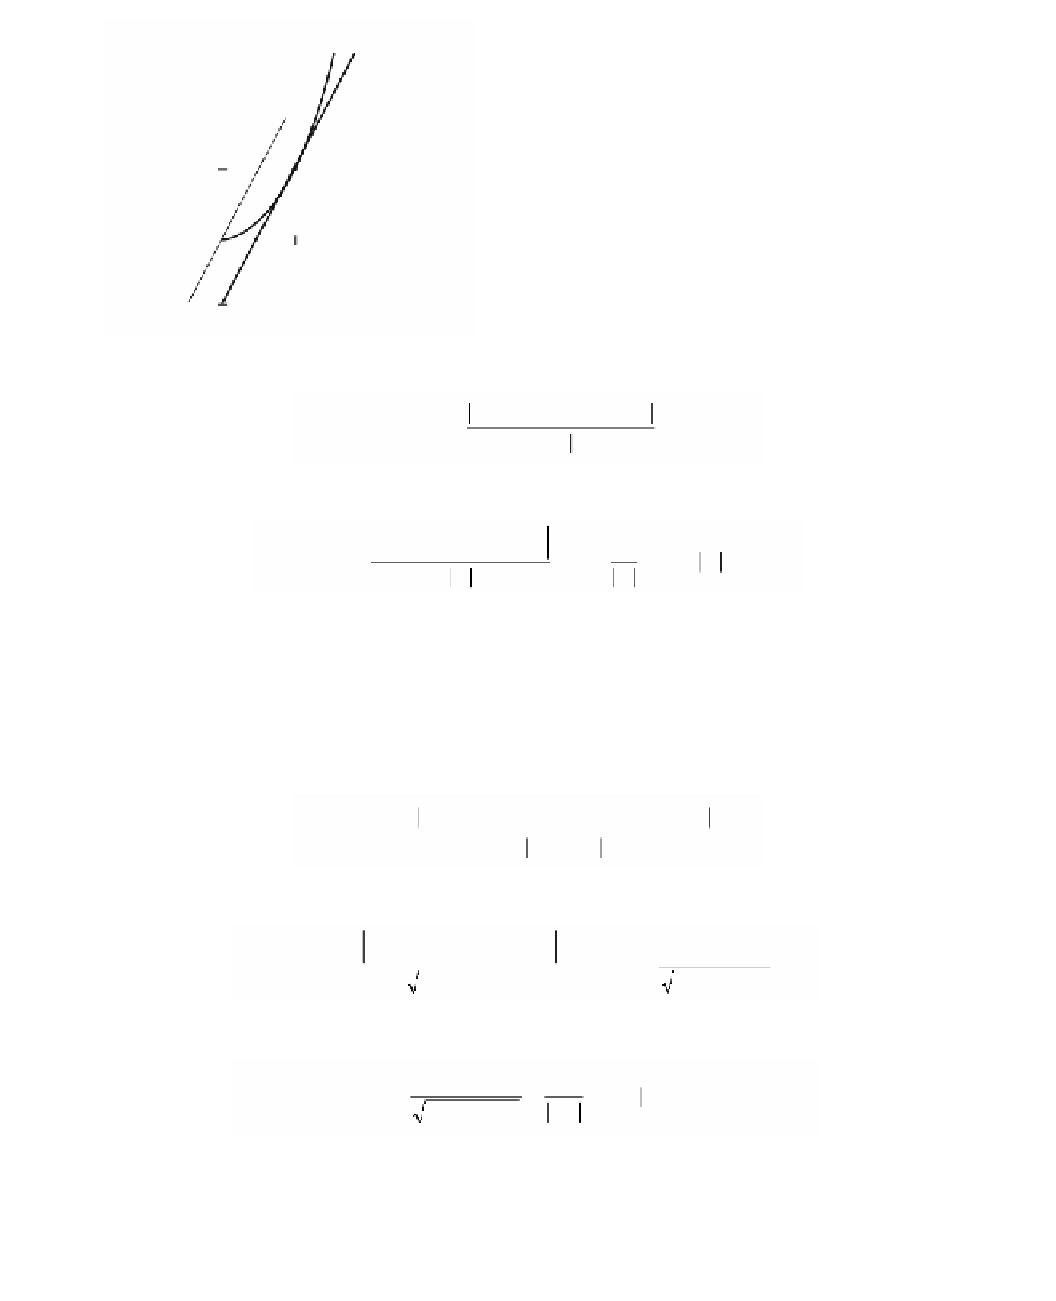
Figure 4.8.
Example 4.3.2.
y = x
2
T
1
(x)
Df(1)(x)
1
(1,1)
x
1
(
)
-
()
-
fa h
+
fa
2
ah
L
=
lim
.
h
h
Æ
0
We must show that the limit L exists and is zero. But
2
(
)
2
ah
+
--
a
2
ah
2
h
h
L
=
lim
=
lim
=
lim
h
=
0
.
h
h
Æ
0
h
Æ
0
h
Æ
0
Figure 4.8 shows the graph of the linear map Df(1)(x), which is the derivative of f at
1, and the graph of the linear function T
1
(x) defined by equation (4.4), which defines
that tangent line to f at (1,1).
The derivative of f(x,y) = x
2
at (a,b) is defined by Df(a,b)(x,y) = 2ax.
4.3.3. Example.
Proof.
We must show that
(
)
-
(
)
-
fa
+
DD
xb
,
+
y
fab
,
2
a x
D
L
=
lim
=
0
.
(
)
DD
xy
,
(
DD
xy
)Æ
0
But
2
(
)
2
ax a ax
+
D
--
2
D
2
D
DD
x
L
=
lim
=
lim
=
0
,
2
2
2
2
(
DD
xy
,
)Æ
0
DD
x
+
y
(
DD
xy
,
)Æ
0
x
+
y
because
2
2
D
DD
x
D
D
x
x
£
=
D
x
.
2
2
x
+
y
Example 4.3.3 highlights one problem for those readers who are new to the
definition of vector-valued function derivatives. The notation Df(a,b)(x,y) looks very