Geoscience Reference
In-Depth Information
example, have shown that more than about 50% of the fallout may be stored in
the vegetation canopy in both grassland (Bettoli et al.
1995
; Kaste et al.
2011
) and
forested (Kaste et al.
1999
) areas. Moreover, variations in vegetation type, density,
height, etc. are likely to lead to significant variations in the
7
Be flux to the underlying
soil and the resulting total
7
Be inventory. The net effect is that the use of
7
Be as a
tracer of sediment redistribution is generally limited to areas of bare ground where
the influences of vegetation are absent.
The short half-life of
7
Be also leads to significant variations in total
7
Be inventories
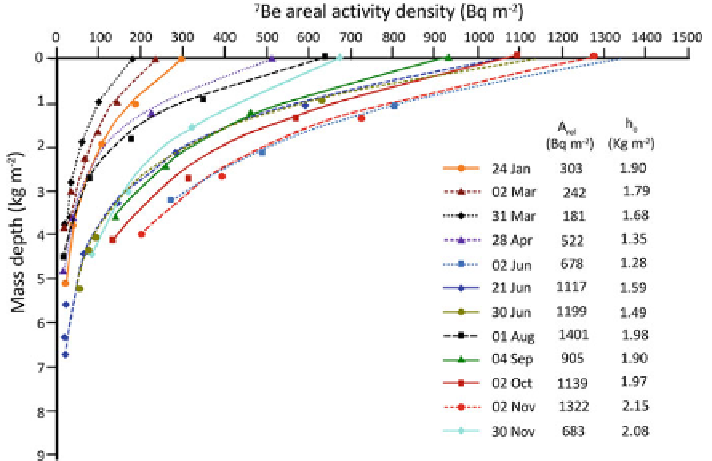
and penetration depths within the soil. Figure
3.9
, for example, shows the variations
in
7
Be inventories and relaxation depths for a reference site near Valdivia, Chile as
reported by Walling et al. (
2009
). The depth-distribution curves correspond to sam-
ples collected over an 11month period extending from January 24 to November 30,
2006. Soil inventories and relaxation depths are relatively low during the dry sum-
mer months (November through early June), but systematically increase during the
wet season (late June to early November). The dynamic nature of the
7
Be inventory
and depth distribution leads to two significant issues. First, estimates of soil erosion
and deposition are typically determined for
7
Be using a profile distribution model
developed for
137
Cs for uncultivated fields. The model requires the depth distribution
of
7
Be to be known. Thus, the dynamic nature of the
7
Be inventory and depth dis-
tribution curves during an extended monitoring period will increase the uncertainty
in the results, and limits the use of
7
Be to a period of a few weeks. Second, and
Fig. 3.9
Variations in
7
Be active as a function of depth below the ground surface for data collected
on multiple dates at a reference site in Valdivia, Chile. Soil inventories (Aref) and relaxation depths
(ho) are low during the dry summer months of November through early June, but increase during
the wet season (late June to early November) (from Walling et al.
2009
)
Search WWH ::

Custom Search