Geoscience Reference
In-Depth Information
was based on three measured terms. First, the initial inventories, or the amount of
the tracer present in each of the landscape elements of interest prior to disturbance
must be known. These initial inventories are usually assessed using the radionuclide
activities found at a reference site that is extrapolated to the whole of the catchment.
Second, the area covered by the defined landscape elements of interest must be
determined. Third, the current inventory present within the landscape elements must
be measured, a value that represents the amount of tracer left following disturbance
(Wallbrink et al.
2002
). The product of the tracer inventories and area measured for
a landscape element is then assumed to be the total amount of each tracer in that
element, and the value used in constructing the sediment budget. Results from the
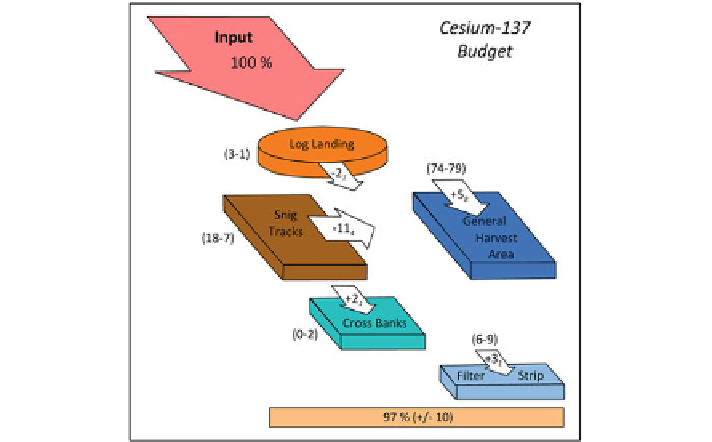
study are shown in Fig.
3.7
, and led Wallbrink et al. (
2002
) to conclude that the
practice of dispersing flow and sediment from the highly compacted snig tracks to
less compacted and spatially larger general harvest areas and filter strips was effective
at retaining surface soil and sediment mobilized from a harvested area. It is important
to note that when the sediment budgeting approach is being used to assess the effects
of a specific disturbance (forest harvesting in the case of Wallbrink et al.
2002
), then
the amount of erosion and/or deposition that has occurred between the initial timing
of radionuclide fallout and the beginning of the disturbance regime must be known.
Fig. 3.7
Tracer budget based on
137
Cs constructed by Wallbrink et al. (
2002
) about 6years after
forest harvesting within a small catchment of the Bondi State Forest, New South Wales, Australia.
The relative amount of sediment contained within each landscape unit is shown in parentheses.
The relative percent of the total sediment input that was transported out of or deposited within
the landscape units are shown by values within the
arrows
. Cumulative errors associated with
measurement errors and element surface area derivations are shown by subscripts (from Wallbrink
et al.
2002
)
Search WWH ::

Custom Search