Geoscience Reference
In-Depth Information
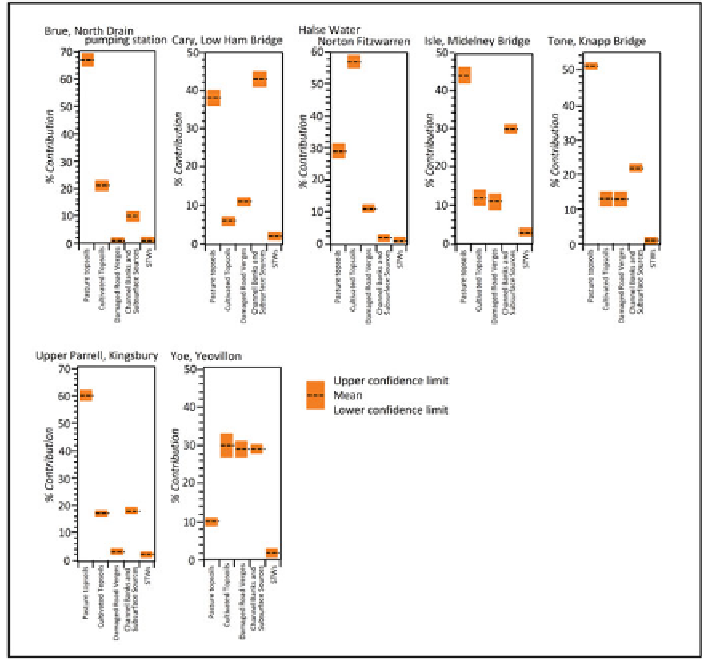
Fig. 2.8
Proportional contribution of sediment to floodplain surface samples collected at the mouth
of seven subcatchments in the Somerset Levels, south west UK. Note variability in source contri-
butions between catchments (from Collins et al.
2010a
)
responsible for assessing the potential sources and impacts of pollutants on aquatic
resources, and for providing advice to stakeholders who are in need of assistance in
protecting aquatic environments (Collins et al.
2010b
). The goal of the project was to
determine the relative contribution of sediment from five sediment sources: pasture
lands, cultivated topsoil, damaged road verges, channel banks and other subsurface
sources (e.g., gullies), and sewage treatment wastes (a point source). The fingerprint
was developed using the procedures outlined by Collins et al. (
1997a
) from a suite
of 40 geochemical parameters analyzed for each of the source area samples. Inverse
modeling relied on a Monte Carlo approach and the modified optimization method
descibed above which included correction factors for grain size and organic mat-
ter content as well as weightings for tracer discriminatory ability and within-source
variability of the individual tracers. The generated results were provided in terms
of the mean contribution from the defined sources and their 95% confidence lim-
its. Figure
2.8
shows that the contribution from each of the sediment sources varied
Search WWH ::

Custom Search