Geoscience Reference
In-Depth Information
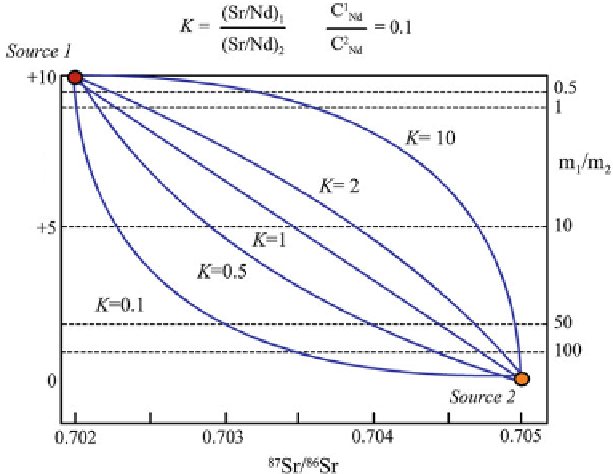
Fig. 4.2
Theoretical mixing
curves
plotted between two distinct end-member sources on a Nd-Sr
diagram.
Curves
represent various relative concentrations of Nd and Sr within end members. K is
the ratio of the Nd/Sr ratio in the two sources; the ratio of Nd concentrations in the sources is set at
0.1. The results are graduated in units of a mass ratio
m
1
/
m
2
(from Allègre
2008
; Isotope Geology,
Fig. 6.17, pp 246; copyright ©2008 Claude J Alle'gre. Reprinted with the permission of Cambridge
University Press)
R
1
mix
=
R
1
A
x
1
+
R
1
B
(
1
x
1
)
(4.2)
R
2
mix
=
R
2
A
y
1
+
R
2
B
(
1
y
1
)
(4.3)
where
R
1 and
R
2 are the isotopic ratios of interest (
87
Sr/
86
Sr ratio and
143
Nd/
144
Nd)
and
m
1
C
A
m
1
C
A
+
x
1
=
(4.4)
m
2
C
B
m
1
C
B
m
1
C
A
+
y
1
=
(4.5)
m
2
C
B
A
and
B
are the two chemical elements of the ratios under consideration,
C
A
and
C
A
are the concentrations of element
A
in the two end-member sources, and
C
B
and
C
B
are the concentrations of element
B
in the two end-member sources. Equations
4.2
and
4.3
can be combined to produce a mixing equation that takes the form of:
R
1
1
−
R
1
mix
R
1
mix
−
R
2
1
−
R
2
mix
R
2
mix
−
R
1
2
=
K
(4.6)
R
2
2


Search WWH ::

Custom Search