Geography Reference
In-Depth Information
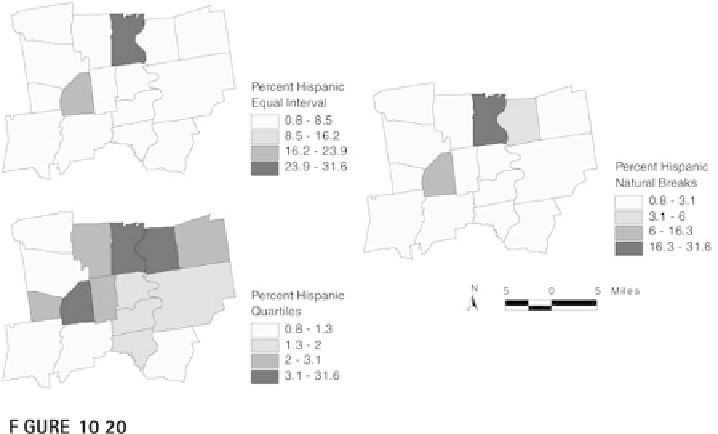
Examples of choropleth maps of the same data using different class interval methods.
From Cromley & McLafferty (2002). Reprinted by permission of Guilford Publications.
DOT-DENSITY MAPS
A dot-density map or visualization is used to show the quantity of a property
by placing a dot in a geographic unit for each incident of a property (or mul-
tiple of incidents). The dots can either be placed to correspond to the posi-
tion of the incidents, or randomly placed within each geographic unit. The
former provides an excellent understanding of the property's geographic
distribution, but must be prepared by hand or with specialized software.
Summary
Principles of cartographic representation include scale, generalization, clas-
sifications, media formats, and cartographic presentation types. Geographic
representation is how to abstract things and events from the world. Carto-
graphic representation deals with the creation of visual techniques and
forms for the geographic representation. Depending on the means and
modes of communication, different cartographic representations could be
required. A classroom wall map of Europe or North America will show
things and events differently than a small map of Europe or North America
on a television news broadcast. The design of maps and visualizations is
essential to successful geographic communication.
Key concerns for cartographic representation center on the design of
maps and other material that reliably abstract from and with geographic rep-
resentations. Cartographic representations are in many ways inseparable
from geographic representation. High-quality communication often con-

Search WWH ::

Custom Search