Geology Reference
In-Depth Information
to other surfaces can be determined. This concept was
developed for the Moon and was veri
ed when rock
samples were returned to Earth for analysis and radiogenic
dating (
Fig. 2.10
). Research by NASA planetologist Don
Gault showed that, with time, cratered surfaces reach a
stage, called equilibrium, in which craters of a given size
are obliterated by impact erosion at the same rate as they
are formed, as shown in
Figs. 2.11
and
2.12
. Thus, only
surfaces that have not yet reached equilibrium for the
crater sizes being considered can be dated (
Fig. 2.13
).
In practice, dif
culties can arise in using crater statistics
for age determinations. For example, non-impact craters,
such as those formed by volcanic processes, might be
indistinguishable from impact craters, and, if non-impact
craters were present, the surface would appear anoma-
lously old. In addition, secondary craters are formed by
the impact of rocks ejected from primary impact craters.
Their presence adds to the total crater population and must
be taken into account by various models that predict how
many secondary craters would form as a function of the
primary crater size. Unfortunately, such models are imper-
fect, and it is dif
cult to determine the presence and
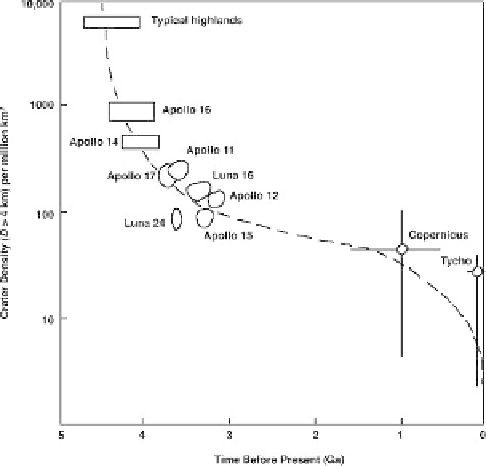
Figure 2.10. Number of craters larger than 4 kmper unit surface area
versus the age in gigayears (Ga), calibrated against absolute dates
obtained from lunar samples. This curve enables extrapolation of
ages to surfaces lacking samples on the basis of crater counts (from
Spudis,
1996
, after Heiken et al.,
1991
; reprinted with permission
from Smithsonian Institution Press).
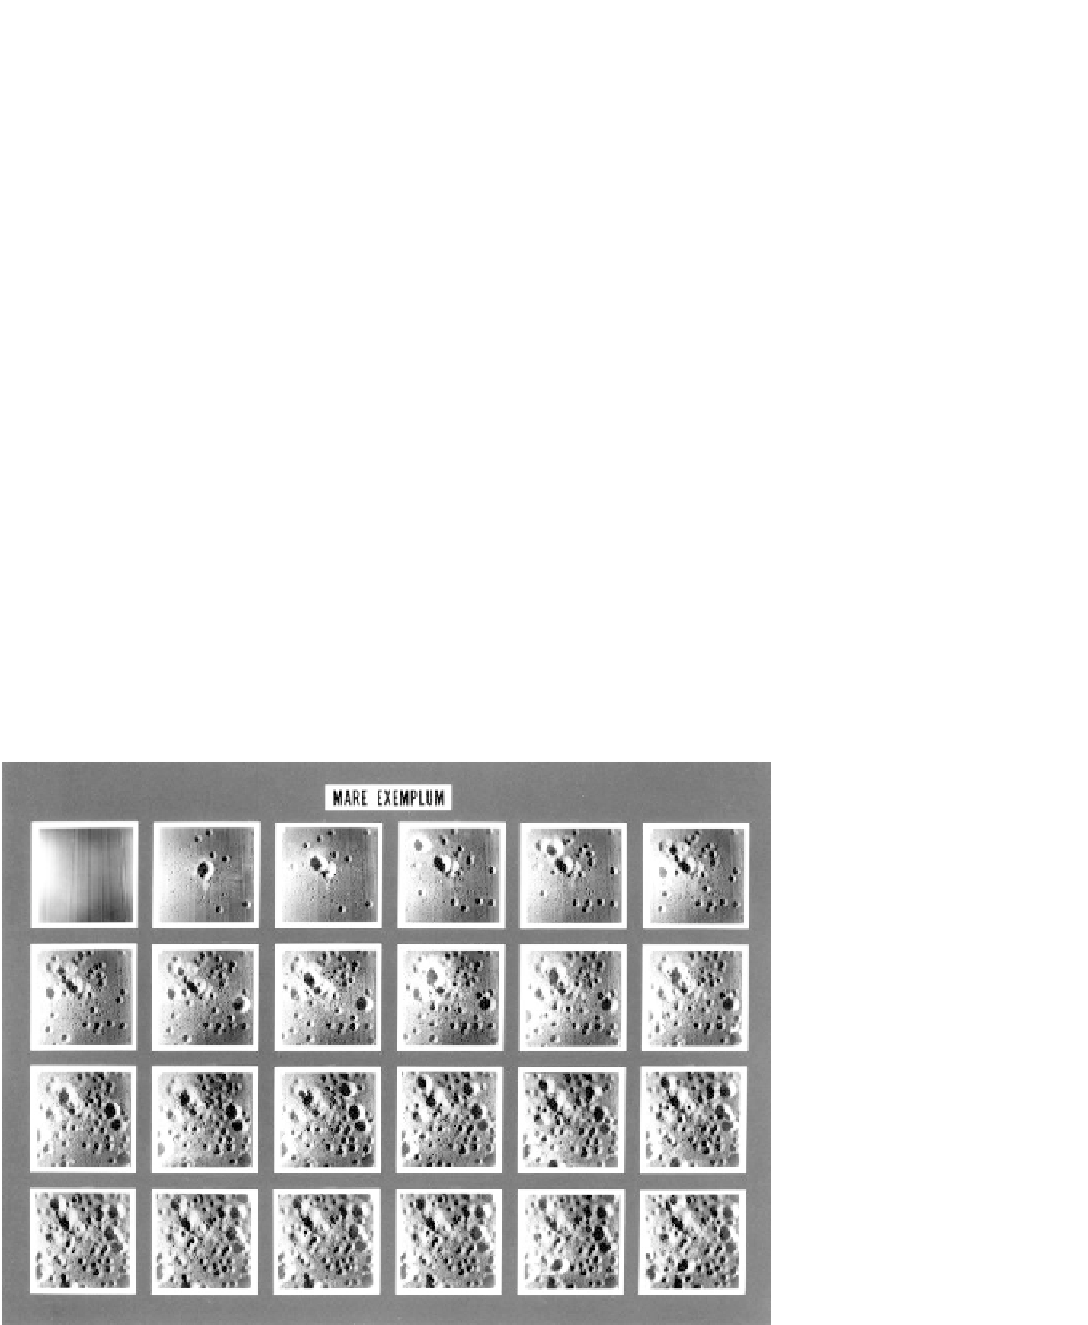
Figure 2.11. Photographs showing a NASA experiment (called Mare Exemplum) to simulate the evolution of a cratered surface. In this experiment, a
box3.2mby3.2mwas
lled with loose sand, smoothed (upper left), and then impacted with bullets of different sizes (ranging frombirdshot to high-
powered ri
e). Placement of each shot followed a grid system and a random-number generator; the ratio of differently sized impacts was based on
the size
frequency distribution of craters seen on lunar mare surfaces. The end of the series is in the lower right. The series illustrates how crater
counts can be used to date surfaces; surfaces in the top photographs represent younger surfaces in comparison with those in subsequent
photographs. Note, however, that in the last row of photographs the crater size frequencies are essentially the same, representing cratering
equilibrium, in which craters are being destroyed at the same rate as that of crater formation; thus, it is not possible to date surfaces within the last
row of photographs (courtesy of Don Gault).
-