Information Technology Reference
In-Depth Information
From this modification, the induced voltage at any point
x
in the distribution line can be
given by the sum of individual contribution in relation to each discrete current component.
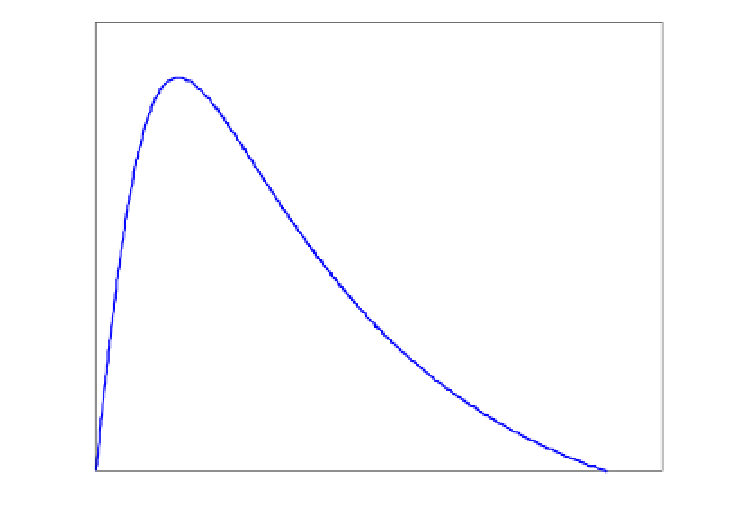
Supposing an atmospheric discharge characterized as in Fig. 7, occurring in a distance of
100m from infinite distribution line with 10m of height, the voltage waveform at the point
x=0m (point of maximum voltage value) can be represented as in Fig. 9.
3.5
x 10
4
3
2.5
2
1.5
1
0.5
0
0
1
2
x 10
-4
time (s)
Fig. 9. Induced voltage at the point of maximum voltage value for a current waveform
expressed in terms of Heidler's function.
3.2 Considerations for induced voltage estimation in finite lines
Rusck's expression for induced voltage calculation in distribution lines is composed of two
parcels, which can be observed through the following equation:
V(x,t) U(x,t) U( x,t)
(9)
0
0
0
where
V
(
x
0
,
t
) is the induced voltage at the point
x
of the line;
U
(
x
0
,
t
) is the induced voltage
component due to the load contribution located at the right part of this point and
U
(
-x
0
,
t
) is
the induced voltage component due to the load contribution located at the left part of
x
0
.
In Fig. 10 is presented the interpretation of induced voltage proposed in the formulation
suggested by Rusck.
In case of a finite line, some modifications in Rusck's theory must be incorporated in order
to enable that the induced voltage estimation in any point of the distribution line to be
modeled adequately according to real situations.
Hence, we assume a line with termination in
x
1
with impedance of termination
R
f
as
indicated in Fig. 11.