Information Technology Reference
In-Depth Information
It is observed from Fig. 2 that the induced voltage waveform modifies in relation to the
distance between the maximum voltage point and the measurement point. The alterations in
the induced voltage waveforms along the distribution line can be better verified through
their parameters, such as maximum induced voltage, rising time, peak time and half-wave
time.
For comparative effects, it is assumed as rising time that necessary time for the voltage
wavefront to reach 90% of its maximum value, considering half-wave time as that
necessary time for the voltage wavefront to reach 50% of peak value after the occurrence
of its maximum value. Therefore, Fig. 3 to 6 presents how these parameters are altered in
relation to the distance between the maximum voltage point and a point along this
conductor.
x 10
4
3.5
3.4
3.3
3.2
3.1
3
2.9
0
100
200
300
400
500
600
700
800
900
1000
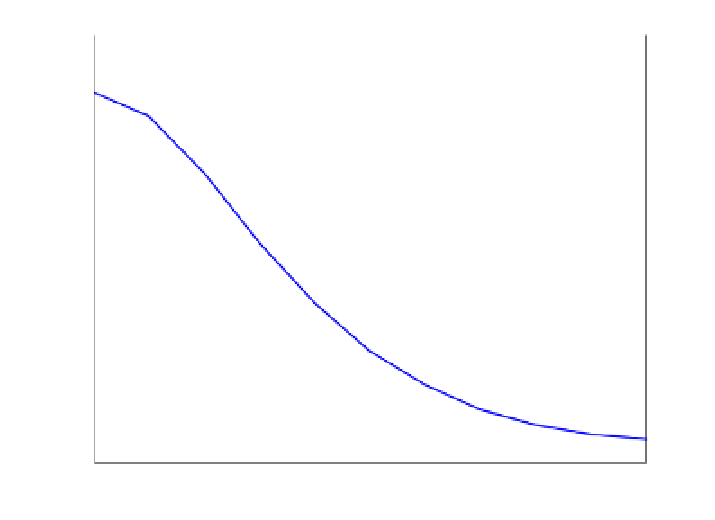
distance (m)
Fig. 3. Maximum induced voltage variation along the line.
From Fig. 3, it is observed that the voltage along the line length reduces at a rate practically
linear in relation to the distance from the atmospheric discharge occurrence point. This
observation indicates that the voltage wave along the distribution line suffers an attenuation
generated from high frequencies involved with the propagation process as well as from
energy dissipation in relation to the metallic conductors.
Figs. 4 to 6 illustrate how rising time, peak time and half-wave time alter along the
distribution line. We can certify that these three parameters tend to increase at a rate
practically constant along the distribution line.
This fact indicates that the voltage waveform loses energy in relation to the distance along
the line since that rising time, peak time and half-wave time higher cause voltage gradients
more smooth along the line.