Environmental Engineering Reference
In-Depth Information
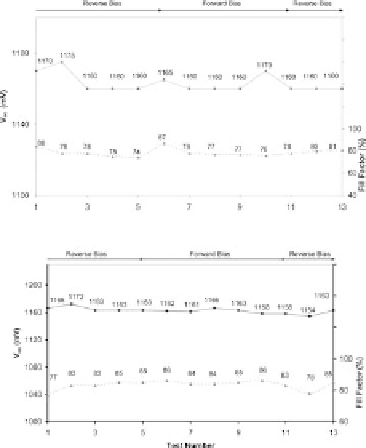
(a)
(b)
Test Number
Figure 9.9
The variation of
V
oc
and FF as a function of applied forward-
and reverse-bias electrical stresses on two 3
×
3mm
2
solar cells.
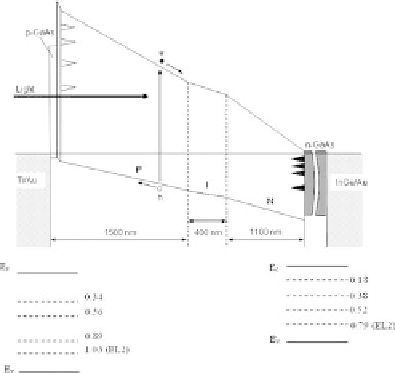
Figure 9.10
A sketch of the energy band diagram of the AlGaAs/GaAs
solarcelltogetherwithwell-establisheddefectlevelspresentinAlGaAsand
GaAs materials near metal contacts.