Environmental Engineering Reference
In-Depth Information
Figure 7.7
A band diagram of the device fabricated during first growth
due to high doping concentrations at both ends of the structure.
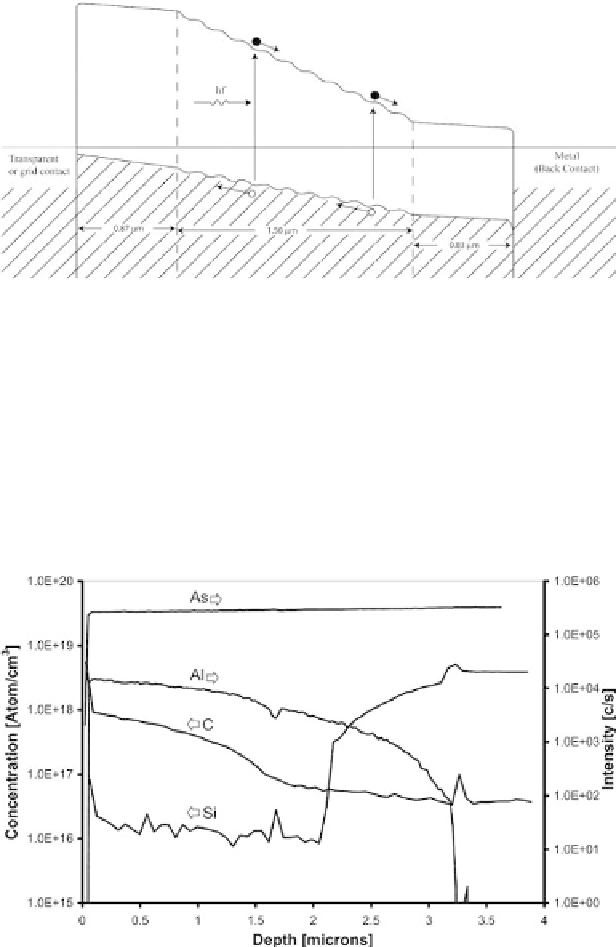
unquantified (right-hand scale) in this graph. As expected, the As
concentrationremainsconstantthroughoutthestructureandtheAl
concentration gradually increases towards the front of the device.
The termination of the Al signal at 3.2
μ
m from the front surface
produces an approximate value for the thickness of the solar cell.
A peak on the C signal also coincides with this value, confirming
Figure 7.8
A typical SIMS depth profile through the AlGaAs/GaAs solar
cellshowinghighdopingconcentrations,ofabout10
18
cm
−
3
,forn-type(Si)
and p-type (C)dopants.