Environmental Engineering Reference
In-Depth Information
X25 IV System
PV Performance Characterization Team
1.2
1
0.8
0.6
0.4
0.2
0
-0.2
-0.4
-0.6
-0.4 -0.2 0 0.2 0.4 0.6 0.8 1 1.2
Voltage (V)
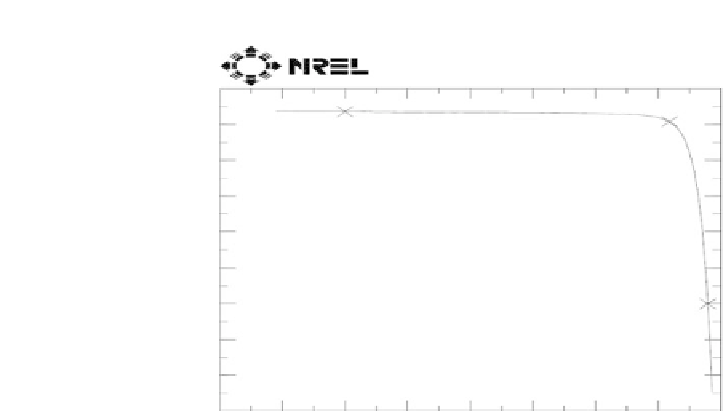
Figure 7.4
A typical I-V curve measured under AM1.5 illumination for a
3
3mm
2
graded bandgap multilayer GaAs/AlGaAs solar cell showing
V
oc
=
1
,
171 mV,
J
sc
=
12 mAcm
−
2
,FF
=
0.85, and
η
=∼
12%.
×
Table 7.3 A summary of solar cell parameters measured at five different
laboratories for 3
×
3mm
2
graded bandgap solar cells processed in one
batch
J
sc
(
mAcm
-2
)
R
s
(
cm
2
)
R
p
(
cm
-2
) Place of Assessment
Device V
oc
(mV)
FF
1
1,170
0.87
—
—
—
SHU Labs
2
1,160
0.86
—
—
—
Dharmadasa
et al.
3
1,148
0.86
10.7
2.5
10,400
Zurich Labs
4
1,141
0.86
10.3
4.0
5,100
Tiwari
et al.
5
1,169
0.85
11.5
—
—
SBU Labs
6
1,149
0.86
10.0
—
—
Reehal
et al.
7
1,150
0.85
12.1
3.8
—
EPFL Labs Gratzel
et al.
8
1,159
0.85
12.3
—
—
NREL, US
9
1,171
0.85
12.0
—
—
Gessert
et al.
It is noteworthy that during measurements,
V
oc
values of 1,180,
1,195, and 1,205 mV have also been observed. This is a typical be-
haviour of electronic devices and a strong indication of the possibil-
ityof
V
oc
exceedingakeymilestone,1,200mV,forthesedevices,with