Image Processing Reference
In-Depth Information
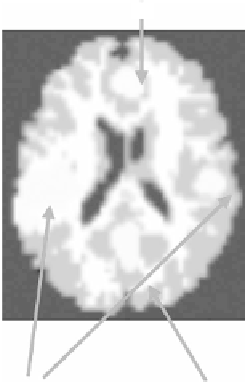
Added activations
Strong
Medium
Weak
(a)
Y
X
T
T
X
Y
(b)
(c)
(d)
(e)
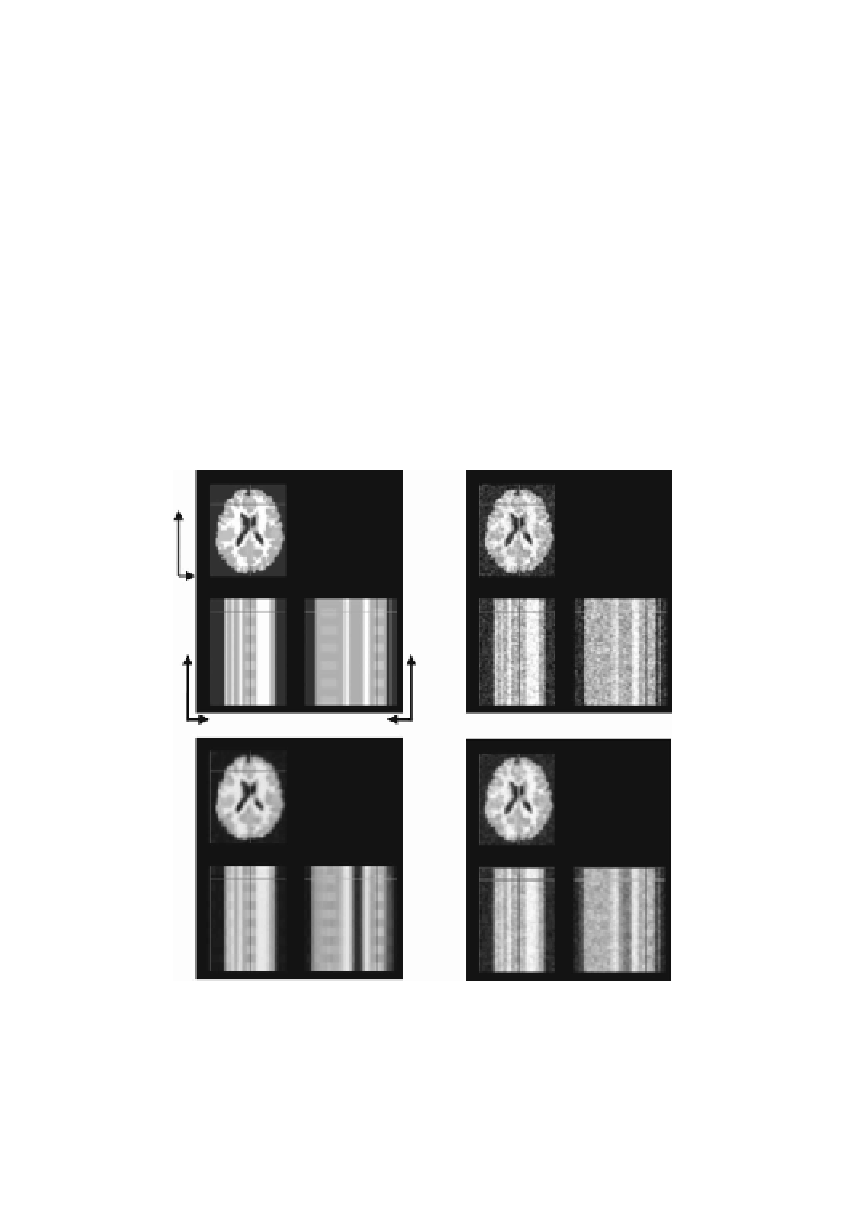
FIGURE 18.4
series (2-D + T
data), visualized with 3 orthogonal slices (spatial axes: X, Y; time axis: T).
(a) Added activations on a 2-D brain slice; (b) Ground truth data; (c) Simulated noisy
data, with noise level
N
(0, 30
2
); (d) Restored data by the ST-SVR (
W-model
= 1); (e)
Gaussian-smoothed data with Gaussian standard deviation 0.5 (s.t.d.
(See color insert following
page 306
). Simulated 2-dimensional time
= 0.5).


Search WWH ::

Custom Search