Image Processing Reference
In-Depth Information
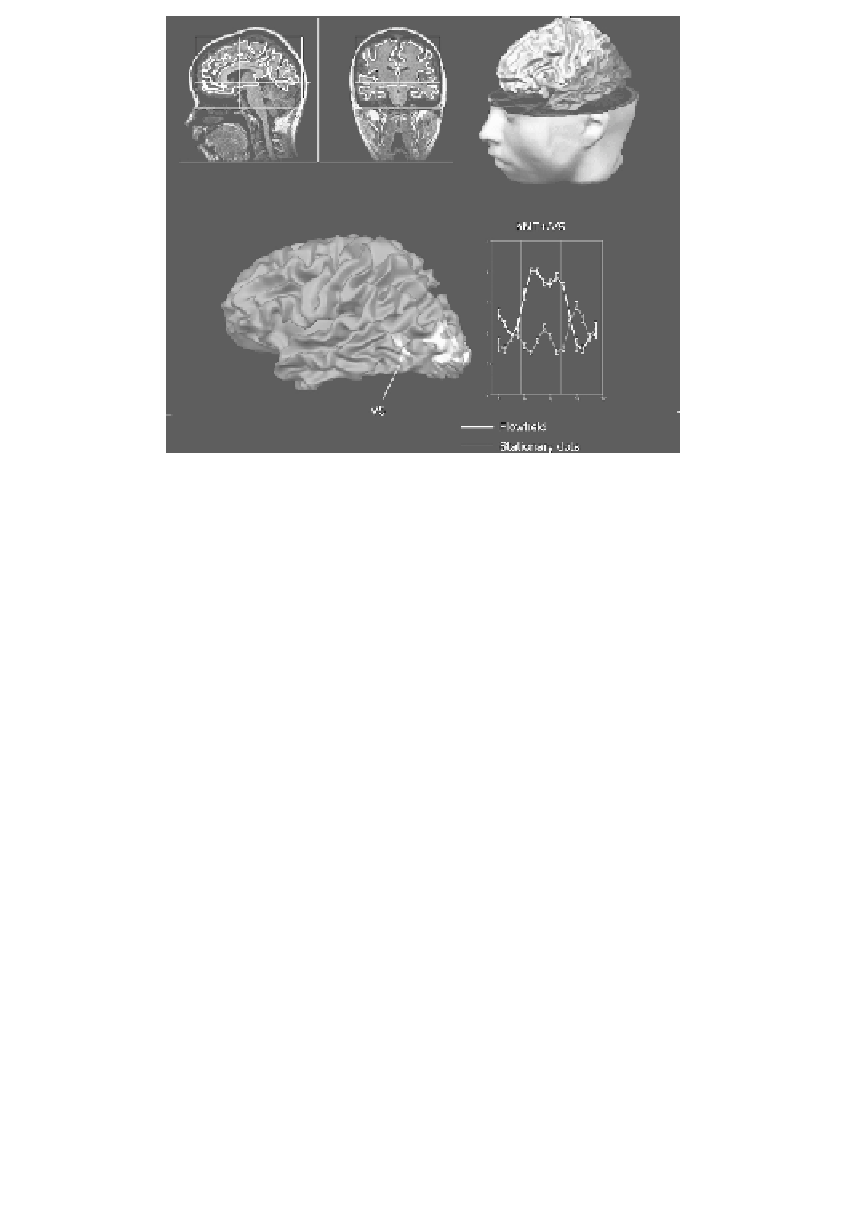
FIGURE 15.6
Advanced visualization of the functional data. Top row: (left) Sagittal and
coronal cuts showing sections of the border between gray matter and white matter as
defined by the segmentation; (right) reconstruction of the subject's head and cortex
obtained from the 3-D anatomical images. Lower row: functional activation in hMT + /V5
during a visual motion experiment represented on the mesh reconstruction of the subject's
cortex.
within sulci [47, 48]. Cortex inflation uses two forces, the corrective smoothing
and the distortion reduction force, which are iteratively computed and applied to
each vertex of the surface mesh. The “smoothing force” acts on the surface so
that points that lie in concave regions move outward over time, whereas points
in convex regions move inward. The “distortion reduction force” constrains the
evolving surface to retain as many of the original metric properties as possible.
It is possible to control the relative strength of the two forces by means of two
coefficients,
λ
d
for the distortion reduction force,
respectively. During the first 200 - 500 iterations,
λ
s
for the smoothing force and
λ
s
takes on values much larger
than
λ
d
(0.4-0.8 vs 0.01-0.05), and gradually decreases over time as the surface
successfully inflates. Minimum geometric distortions are obtained by “linking”
the morphing surface to a folded reference representation (S
W
or S
G
), and using
a distortion reduction force that keeps the area of each triangle of the inflated
hemisphere as close as possible to the value of the reference mesh. In this way,
the inflated hemisphere also possesses a link to the functional data, as these are
coregistered with the 3-D data set and the folded surface. A functional map may
be, therefore, shown at the correct position of the inflated representation. The
display of functional maps on an inflated hemisphere allows the topographic


Search WWH ::

Custom Search