Image Processing Reference
In-Depth Information
in a predefined sensory, motor, or cognitive stimulation paradigm and (2) the
acquisition of an “anatomical” volume covering a certain region of interest (pos-
sibly the whole brain). Functional time series are acquired using fast or ultrafast
MR sequences sensitive to blood oxygenation level dependent (BOLD) contrast
(conventionally, T2/T2*-weighted echo planar imaging [EPI] sequences). Ana-
tomical volumes, conversely, are acquired using slow MR sequences in which
the contrast between gray and white matter is enhanced (conventionally, high-
spatial-resolution three-dimensional [3-D] T1-weighted sequences) and serve as
a structural reference for the visualization of the functional information obtained
through the analysis of the functional time series.
The aim of this chapter is to provide a basic overview of the data analysis
pipeline that is typically employed in fMRI.
Given the small amplitude (1-5%) of the stimulus-related MR signal changes
and the presence of many confounding effects, the localization and characteriza-
tion of the brain regions that respond to the various conditions of the stimulation
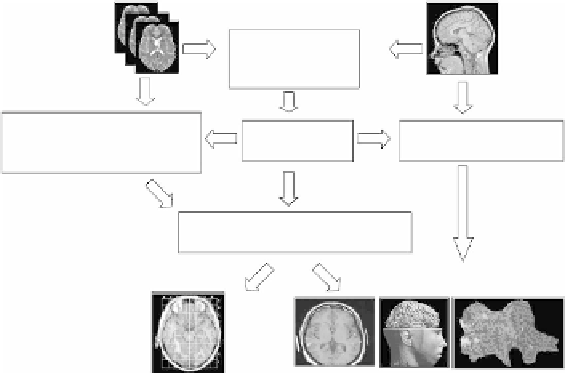
protocol is a nontrivial process that involves several processing steps. Figure 15.1
shows a flowchart of these steps. Some of the steps aim to reduce the influence
of the artifactual signal fluctuations and enhance the functional contrast-to-noise
ratio (realignment, spatial, and temporal filtering; see
Reference 2
). Others aim
to detect localized task-dependent signal changes and to visualize them by means
of activation maps (see
Reference 3
). The step of spatial normalization refers to
the transformation of anatomical and functional data in conventional reference
Recorded time
series (EPI)
Anatomical
images
Coregistration of
functional and
anatomical data
Slice timing correction
Correction of head motion
Spatial and temporal filtering
Spatial
normalization
Segmentation
Cortex reconstruction
Statistical localization of brain
activation, functional maps
Single subject analysis
Group analysis I
Talairach space
Group analysis II
Surface-based alignment
FIGURE 15.1
Schematic flowcharts of the data analysis steps involved in an fMRI
study. Input data are the four-dimensional (4-D, space [3-D]
time [1-D]) functional
time series (left) and the 3-D anatomical reference volumes (right). See text for a detailed
description of each block.
×


Search WWH ::

Custom Search