Image Processing Reference
In-Depth Information
A
B
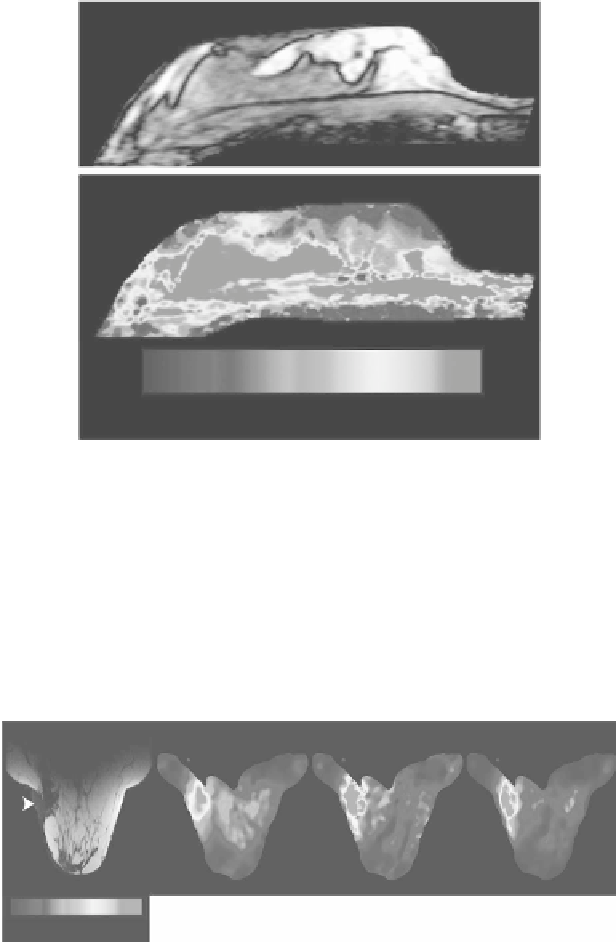
Softer
Stiffer
FIGURE 14.8
(a) Axial T1-weighted spin-echo image of the breast of a normal volunteer.
(b) MR elastogram obtained for this volunteer with shear waves at 100 Hz applied to the
anterior part of the breast. The elastogram depicts clear differentiation between soft adipose
tissue and stiffer fibroglandular tissue.
have reported an anisotropic analysis of 3-D MRE data of the breast and have
suggested that this can help differentiate between benign tissue, which appears
isotropic, and carcinoma, which appears to exhibit an increased degree of
anisotropy.
0
10
Shear stiffness (kPa)
20
30
FIGURE 14.9
T1-weighted image (left) and LFE, DI, and MF elastograms respectively
of the breast of a patient with 4-cm diameter biopsy-proven breast cancer. The image was
obtained with shear waves of 100 Hz applied to the skin of the medial and lateral aspects
of the breast. The field of view is approximately 16 cm and the section thickness is 5 mm.
The elastograms all indicate that the shear stiffness of the tumor in the posterolateral aspect
of the breast (arrowhead) is substantially higher than that of normal fibroglandular and
adipose tissues in the breast.


Search WWH ::

Custom Search