Image Processing Reference
In-Depth Information
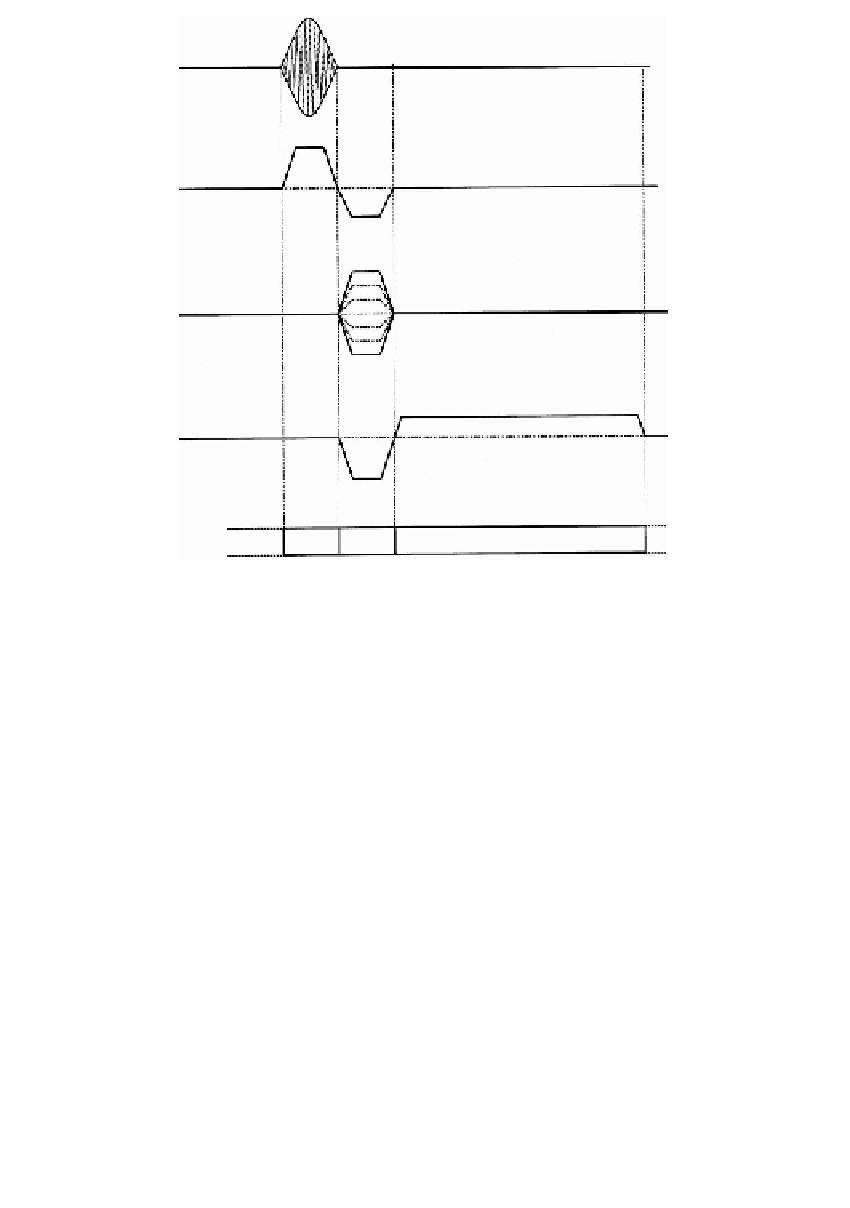
RF
Gz
Gy
Gx
Intervals
I
II
III
FIGURE 1.14
Schematic representation of a sequence timing diagram.
phase-encoding gradient amplitudes can be written:
&
'
∞
)
*
()
∫
−
imG t
γ
st c
m
()
=
ρ
ye
dye
−
i
ω
0
t
(1.41)
(
yy
+
−∞
A Fourier transform applied to the sequence s
m
(t) for different m values, can
be used to compute the position of the object in the y direction. If the signal is
from a collection of point objects in a column with different y offsets, the Fourier
transform of the resulting signal will yield a spectrum that is proportional to a
profile of the column.
1.9.5
T
IMING
D
IAGRAM
OF
AN
I
MAGING
S
EQUENCE
Image sequence timing diagrams, also called
sequence diagrams
, are commonly
used to describe the implementation of a particular MR sequence, and show the
magnitude and duration of the three orthogonal magnetic field gradients and the
RF pulses. An example of pulse sequence diagram is shown in Figure 1.14. In
particular it shows the two-dimensional Fourier transform image formation method,
as described in Reference 14, that is a development of the earlier technique of
Fourier zeugmatography [5]. It could be considered the basic imaging sequence
from which all the hundreds of image sequences existing nowadays are derived.


Search WWH ::

Custom Search