Image Processing Reference
In-Depth Information
z
z
M
0
90-degree
pulse
y
′
y
′
x
′
x
′
(a)
(b)
z
z
TE/2
180-degree
pulse
y
′
y
′
x
′
x
′
(c)
(d)
z
z
TE
y
′
y
′
x
′
x
′
(e)
(f )
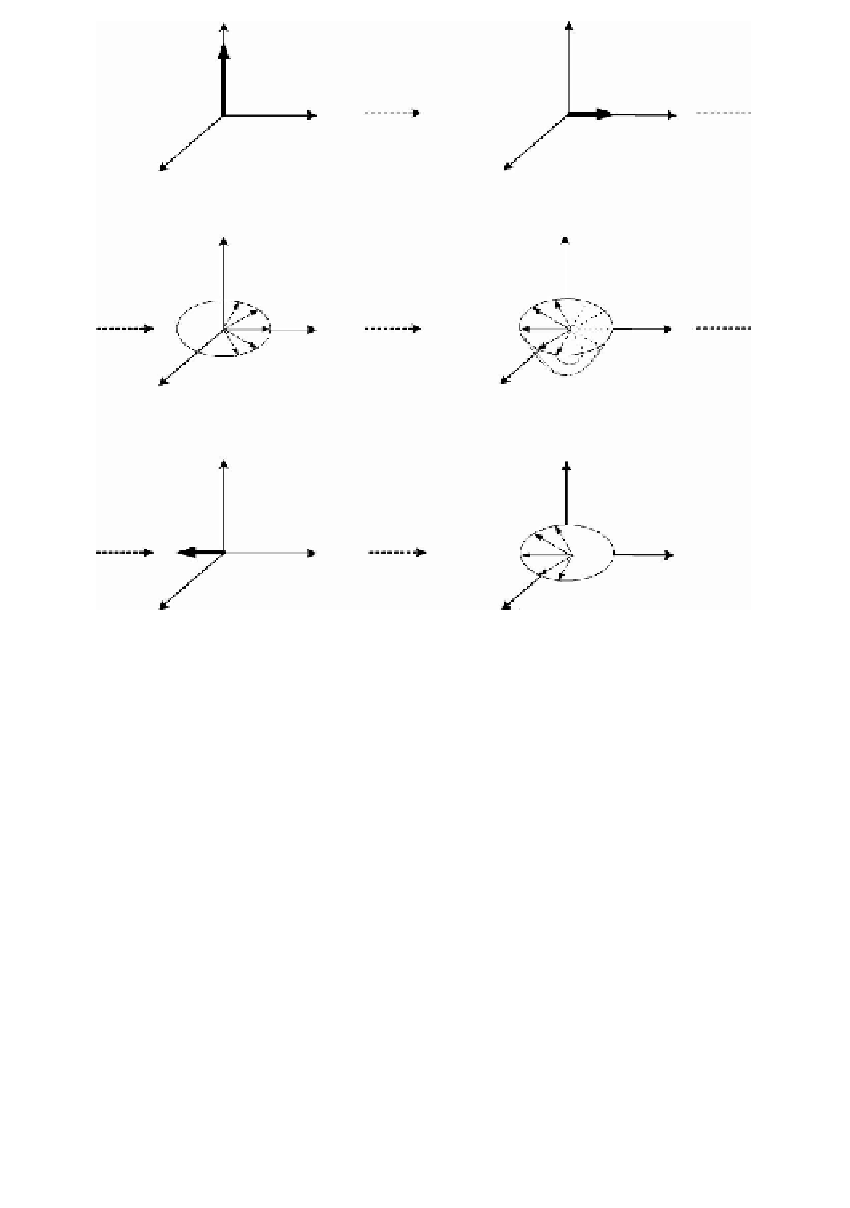
FIGURE 1.9
Rotating frame view of a magnetization subjected to an SE sequence.
after the 180
pulse, the isochromats precessing faster are seen to lag behind
the slower ones. Precession of isochromats for a period TE/2 after the 180
°
pulse
allows the faster isochromats to rephase with the slower ones, and at this instant
all isochromats will be refocused along the negative y
°
axis (Figure 1.9e). Further
precession of isochromats following refocusing causes them to dephase in the
xy plane (see Figure 1.9f ). Therefore: following the 180
′
°
pulse, the net magne-
tization along the y
axis (M
y′
) increases, until a maximum is reached at time
TE; after reaching the maximum, the magnetization decreases in a similar
manner to the decay following the initial 90
′
pulse.
The net magnetization M
y′
at this time is determined by the decay due to
spin-spin relaxation only and is given by:
°
MMe
y
=
(1.28)
(
−
TE T
/
2
)
′
0
The maximum amplitude of the echo is proportional to M
y
, given by Equation 1.28.


Search WWH ::

Custom Search