Image Processing Reference
In-Depth Information
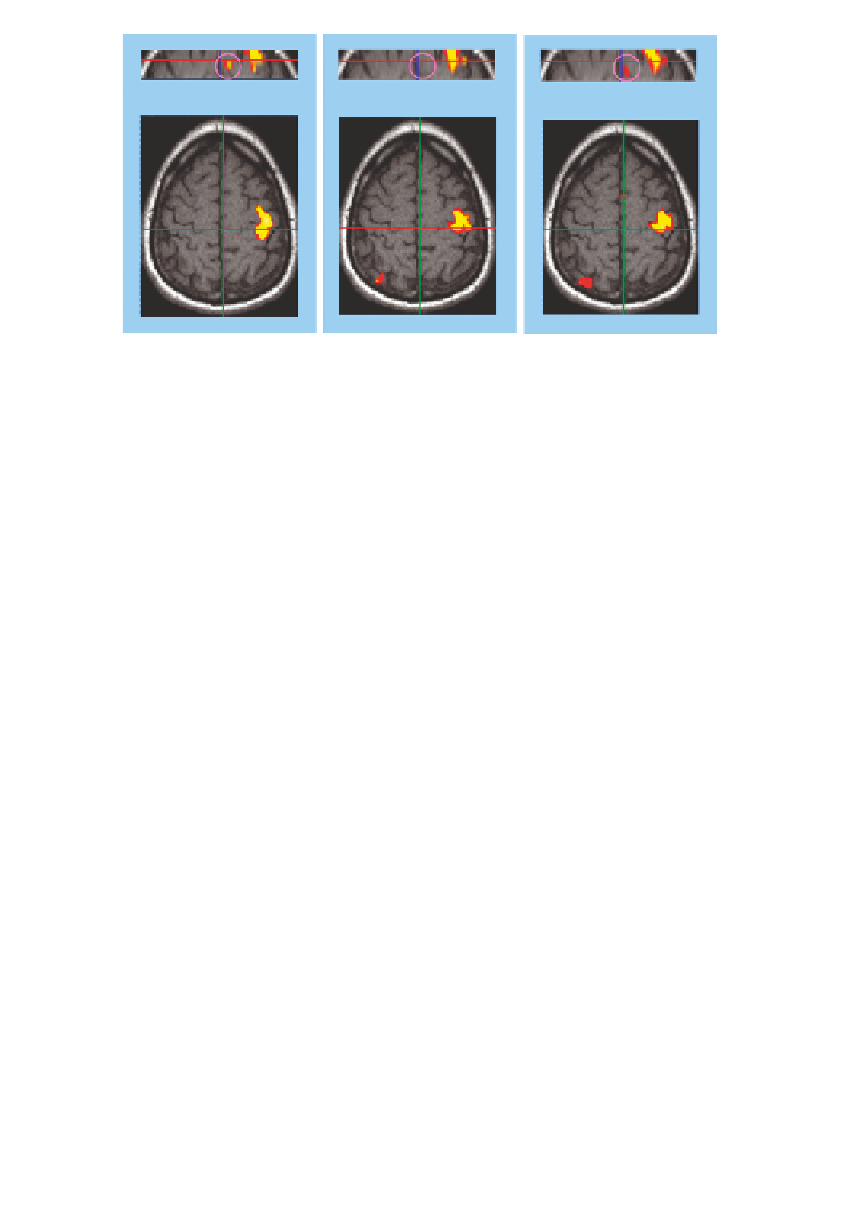
ST-SVR (2 Run)
t
-test (2 Run)
t
-test (4 Run)
SMA
5.3 < t < 10.24
p < 10
−
3.0 < t < 7.17
p < 0.002
3.6 < t < 9.45
p < 0.001
6
(a)
(b)
(c)
COLOR FIGURE 18.9
Multirun result comparison for a motor experiment of real fMRI
data. Top: coronal slices; bottom: axial slices (color activation maps).


Search WWH ::

Custom Search