Image Processing Reference
In-Depth Information
a computer, and direct amplification without introducing distortion is a difficult
task. Therefore, low-level amplitude of the MR signal at the Larmor frequency
is converted to a low-frequency signal by subtracting a frequency component
equal to the frequency of a chosen reference signal (RF detection). The latter
usually is chosen to be equal to that of
B
1
(i.e.,
ω
0
); the resulting low-frequency
signal has a frequency of
in the Hz to KHz range. This signal is amplified
again to the required level. The low-frequency signal (we will call it
base-band
FID
) contains all the information, previously present in the RF signal, which is
required to generate the MR spectrum.
In order to store the base-band FID in a computer, the analog signal is sampled
at specific times (analog-to-digital conversion) and an array of numbers repre-
senting the sampled voltages is stored in the computer memory. The process of
analog signal sampling must be performed in accordance with the Nyquist sam-
pling theorem to ensure that the analog signal is correctly represented in digital
form; the time duration in which the FID is sampled is referred to as the
acqui-
sition
or
readout time
.
When a single group of equivalent nuclei (i.e.,
1
H in a water sample) is
considered, the FID represents a simple decay oscillation at a particular fre-
quency, as described before. This frequency can be determined simply by mea-
suring the period of the oscillation, t
osc
, and calculating the value of 1/t
osc
.
However, if the sample being examined contains different chemical shift fre-
quencies, the observed FID represents the composite of several individual FID
signals, with slightly different frequencies. The individual frequency components
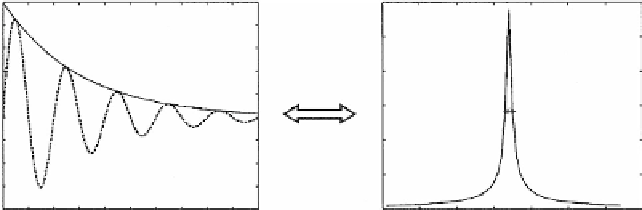
of any FID are most conveniently identified by subjecting the FID to Fourier
transformation. The Fourier relationship between the FID and the MR spectrum
is shown in Figure 1.6. All the characteristics of the FID are represented in the
spectrum, but in a different format: the frequency of oscillation of the FID is
indicated by the horizontal scale of the spectrum, the rate of decay of the FID
is inversely related to the width of the spectral line at its half maximum, and
the height (maximum amplitude) of the spectral line is directly proportional to
∆ω
exp (
−
1/T2)
1/
π
T2
Fourier
transform
Time
Frequency
FIGURE 1.6
Fourier transform relationship between FID in the time domain and fre-
quency domain.


Search WWH ::

Custom Search