Image Processing Reference
In-Depth Information
1.0
0.8
MQ
0.6
0.4
MI
0.2
0.0
−
4
−
2
0
2
4
Rotation angle
(b)
(a)
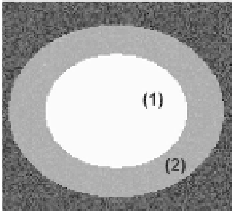
FIGURE 7.2
(A) Synthetic phantom and (B) MQ and MI metrics values for rotation
angles from -5° to + 5°.
The phantom was rotated from -5
in 40 steps, and the normalized values
of square root metric (MQ) and MI between all the rotated images and the original
image (corresponding to 20th frame) were plotted (Figure 7.2B).
From the plot, the two metrics converge to the correct alignment in a con-
tinuous manner; the MQ metric shows a “smooth” convergence around the correct
alignment value, whereas MI presents a clear maximum corresponding to the
20th frame.
The same image sequence was modified including a signal value change along
frames (Figure 7.3A), simulating the presence of an MR contrast medium that
diffuses in blood and in muscular tissues. In this case, the shape of the MI metrics
remains continuous and without local maxima, while the MQ metric shows the
presence of a local maxima at the -3
°
to +5
°
location (Figure 7.3B). The proposed example
shows that, in the presence of signal changes that do not modify the pattern
distribution in images to be registered, metrics related to the image histogram are
°
250
200
150
100
MQ
1.0
(1)
0.8
0.6
0.4
0.2
0.0
50
0
010
20
30
40
MI
120
100
80
60
(2)
−
4
−
2
0
2
4
Rotation angle
0
(a)
10
20
30
40
(b)
FIGURE 7.3
(A) Synthetic phantom with signal change during time and (B) the related
MQ and MI metrics values for rotation angles from -5° to + 5°.


Search WWH ::

Custom Search