Image Processing Reference
In-Depth Information
10
9
8
7
6
5
4
3
2
1
0
0
5
10
15
20
25
30
35
40
45
50
N
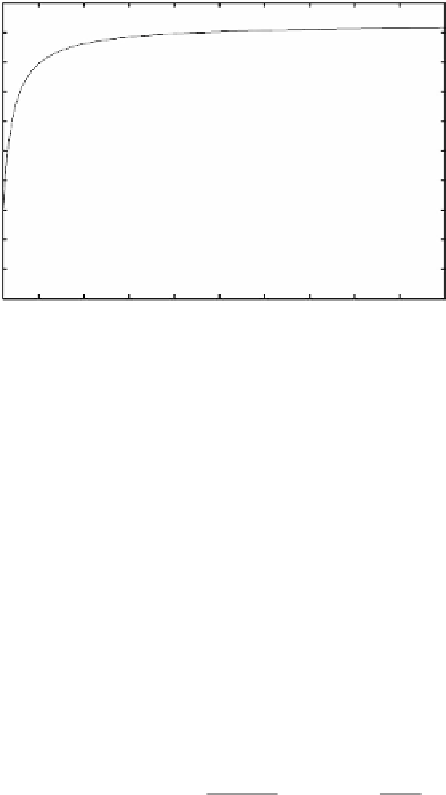
FIGURE 4.11
Performance comparison between the conventional and the ML estimator
of the noise standard deviation: MSE ratio as a function of the number of data points
N
for
K
= 2, 4, and 6.
4.5.3.2
Region of Constant Amplitude
Suppose that a set of magnitude data points is available from a region where
the true signal value
A
is the same for each data point. Then, the CRLB for
unbiased estimation of
{
n
m
2
from magnitude data of a constant region is given by
Equation 4.116, in which the elements are defined by Equation 4.113 to
Equation 4.115.
Furthermore, the value of
σ
σ
2
can be estimated using the ML method as
follows (cf. Equation 4.120):
!
!
B
!
!
N
N
(
)
=
mA
+
Am
∑
2
2
n
ˆ
ˆ
A
,
σ
2
arg
max
−
N
ln
σ
2
−
n
+
ln
I
n
.
(4.163)
ML
ML
0
2
σ
σ
2
2
A
,
σ
2
n
=
1
=
1
Note that it requires the optimization of a two-dimensional function, which
cannot be solved analytically.
4.5.3.3
Double-Acquisition Method
Estimation of the noise variance from a single-magnitude image requires homo-
geneous regions in the image. However, large homogeneous regions are often
hard to find, and therefore only a small number of data points are available for
estimation. Also, background data points sometimes suffer from systematic inten-
sity variations. To overcome these disadvantages, methods were developed based


Search WWH ::

Custom Search