Image Processing Reference
In-Depth Information
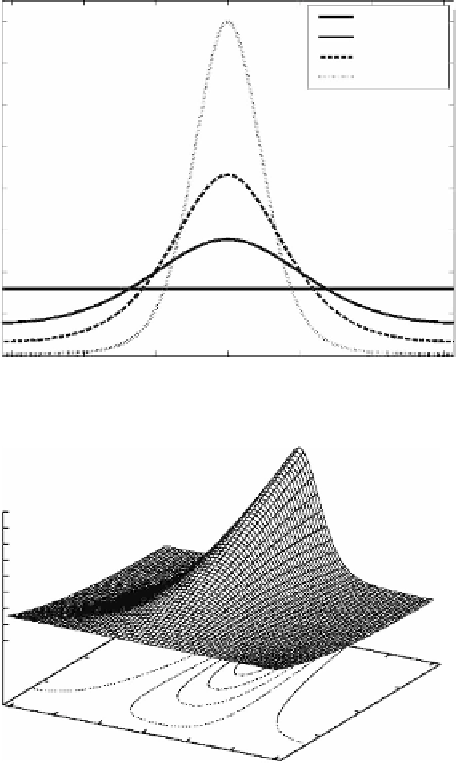
SNR = 0
SNR = 0.5
SNR = 1.0
SNR = 2.0
0.8
0.7
0.6
0.5
0.4
0.3
0.2
0.1
0
−
3
−
2
−
1
0
1
2
3
∆φ
(a)
0.8
0.7
0.6
0.5
0.4
0.3
0.2
0.1
0
2
1.5
1
−
3
−
2
1
−
0.5
0
1
2
0
∆Φ
(rad)
(b)
3
FIGURE 4.3
Plot of the phase error PDF as a function of the SNR. (From Sijbers, J., Van
der Linden, A. (2003).
Encyclopedia of Optical Engineering
, chap. Magnetic resonance
imaging, pp. 1237-1258. Marcel Dekker, ISBN: 0-8247-4258-3.)
•
In regions where there is only noise, (i.e., where the SNR is zero),
Equation 4.37 reduces to a uniform PDF:
!
!
1
2
if
−<∆<
πφπ
π
p
∆
∆=
φ
φ
()
(4.38)
0
otherwise.


Search WWH ::

Custom Search