Image Processing Reference
In-Depth Information
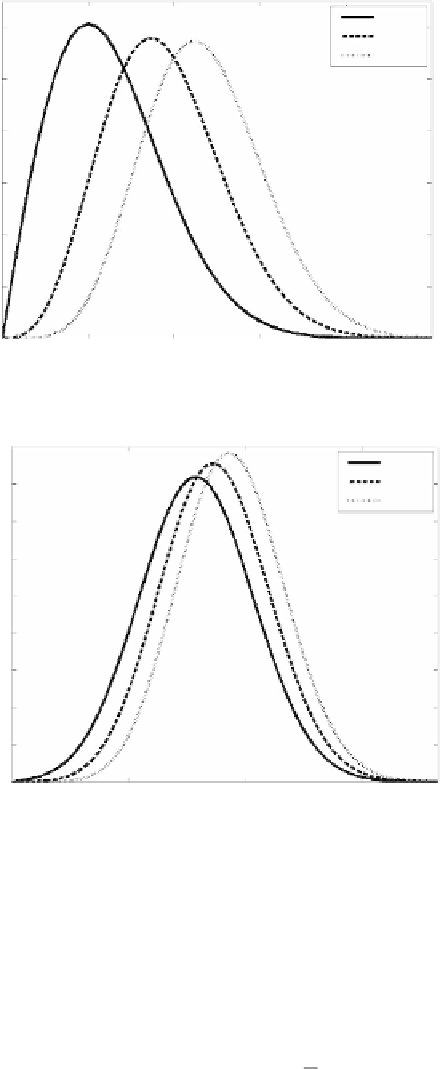
K = 2
K = 4
K = 6
0.6
0.5
0.4
0.3
0.2
0.1
0
0
1
2
3
4
5
m
(a) SNR = 0
K = 2
K = 4
K = 6
0.4
0.35
0.3
0.25
0.2
0.15
0.1
0.05
0
0
2
4
6
m
(b) SNR = 3
FIGURE 4.2
Plots of the generalized Rician PDF as a function of the magnitude variable
m for K = 2, 4, and 6 and with σ=1.
4.2.2.6
PDF of Squared Magnitude Data
w
,
N
,
where all observations are assumed to be statistically independent and Gaussian
distributed with standard deviation
Consider a set of
N
real and imaginary observations
{(
w
,
)}
with
n
=
1,
…
rn
,
in
,
and arbitrary means and respec-
tively. Next, consider the sum of
N
squared magnitude variables constructed from
σ
µ
rn
µ
in
,
,
,


Search WWH ::

Custom Search