Geography Reference
In-Depth Information
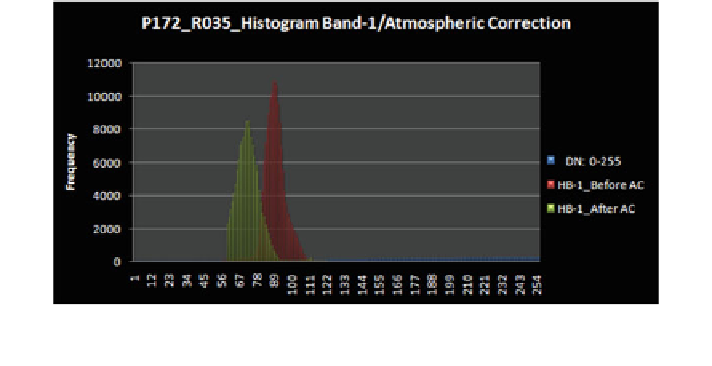
Fig. 5.8 Histogram comparison of the (LANDSAT-TM-Band-1) before and after the atmo-
spheric correction
L=c0 + c1 9 DN,
where:
L = calculated
radiance
on
the
sensor;
DN = digital numbers.
The new atmospheric corrected image (LANDSAT-TM-p172r035-070807) has
new gray-values (e.g., DNs-before: 50, 65, 83; DNs-after: 41, 45, 65). The cor-
rected histogram band 1 has, in comparison to the raw data, the same trends. It is
darker, the individual object-groups are more evident through peak formation in
the corrected data (DN-values), and they are, therefore, better to delimit than in the
raw data (uncorrected) (Fig.
5.8
).
5.2.3 Radiometric Processing/Calibration
The application of the information-extraction algorithms for LULC-classification,
change detection and other remotely sensed Earth observation studies can be
generally useful when the data are radio-metrically processed. On the other hand,
if the user select an approach, that is based on products resulting after classifi-
cation, for mapping the change detection, then radiometric correction is avoidable
(Jensen
2007
). It is true when only one image at each compared time (no mosaic)
is used in classification, and when each image has the same irradiance conditions
(e.g., no haze or dust). However, the using of some change detection approaches
(image differencing), would requires a radiometric normalization. Also, radio-
metric correction is necessary for some applications (e.g., image mosaicing) (Yang
and Lo
2000
).
The radiometric correction set can correct radiometric distortion, which occurs
because of sensor noises and atmospheric effects. Radiometric correction of
remotely sensed data is a process of converting the recorded pixels' brightness
values (where they are simply numbers, without physical units) to an absolute
Search WWH ::

Custom Search