Geography Reference
In-Depth Information
2.5.1 Remote Sensing Approaches for Vegetation Studies
The optical characteristics of vegetation and different leaves were explained in
detail by (Kumar et al.
2001
). In general the reflectance of vegetation in the visible
wavelengths (0.43-0.66 lm) is small and reflection in near infrared (0.7-1.1 lm)
is large (Fig.
2.2
). The life cycle in crop plants includes the three major phases: a
vegetative stage, reproductive phase and a grain-filling stage. Three features of
leaves have an important impact on their reflectance characteristics: pigmentation
(e.g., chlorophyll a and b), physiological structure and water content. Pigments
absorb the energy of the visible wavelengths, where the highest level of absorption
from chlorophyll a is located at 430 and 480 nm, while for chlorophyll b it is at
450 and 650 nm. As, the bandwidth of the TM is too wide to detect these thin
absorption bands (Bidwell
1974
). The reflectance response of vegetation canopy is
affected by: the vegetated and non-vegetated areas spatial distribution, vegetation
classes, leaf area index, distribution of the leaf angle, and bio-chemical and
physical vegetation conditions. The water content of the leaves and water in the
atmosphere decrease overall leaf reflectance and causes some thin absorption
features (Irons et al.
1989
).
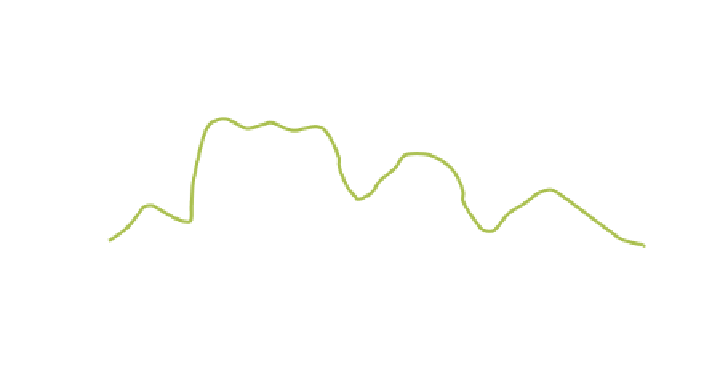
The spectral response of vegetation changes permanently during the growing
season and with alterations in moisture content. Appropriate information about
these changes assists in the determining of the best time period for field work and
in determining biophysical features to be measured. Figure
2.8
illustrates a sim-
plified spectral reaction curve for vegetation from 400 to 2.500 nm. The rela-
tionship between the irradiation absorption and the irradiation reflection illustrated
in this figure changes with wavelength. The biophysical controls (pigment, cell
structure and water) of the irradiation to plant interaction are also affected by
differing wavelengths (McCoy
2005
).
Pigment
absorbtion
No absorbtion
Water absorbtion
60
50
40
30
20
10
0
0.4
0.6
0.8
1.0
1.2
1.4
1.6
1.8
2.0
2.2
2.4
2.6
Wavelength (micrometers)
Fig. 2.8 The typical spectral response curve for vegetation showing the characteristic bands that
differentiate vegetation spectrally (Source modified from Hoffer and Johannsen
1969
)


Search WWH ::

Custom Search