Geography Reference
In-Depth Information
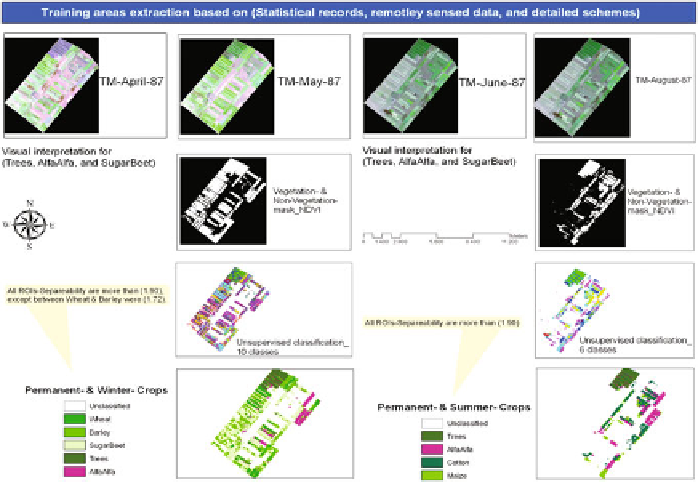
Fig. 5.56 The followed concept to collect training samples for the area/s with no truth-data or
with insufficient reference data (the state farm)
The third step (Fig.
5.56
) was to extract the smallest unit/farm in the 21,000 ha
project to make the reorganization process of various agricultural features easier.
Then, the various record-times/coverages were used in a visual interpretation to
recognize various agricultural features and to define the training samples that
represent these features in a supervised classification. For example, it was possible
to recognize trees, alfalfa and sugar beet using multi-date remote sensing data and
visual interpretation. Based on the agricultural calendar, trees fields appeared as
planted areas over the three datasets (May, June and August); alfalfa appeared as
green areas over the four datasets (April, May, June and August); and sugar beet
fields appeared in April data as diverse planted areas in comparison to wheat and
barley fields. The June data showed the area was still planted in comparison to
other winter crops, especially those that had similar spectral response, such as
wheat and barley. These three various appearances of the wheat at first degree and
the barley in the June data, confirmed the selection for the training samples from
the May data. The region also contained many dairy farms nestled among the
irrigation projects with known geographical locations. These farms were planted
only with barley, and provided a useful basis for training sites. Circular-irrigation
fields also provided a useful source of reference, as the fields appear in a circle-
shape. These fields were planted almost fully in wheat. To this end, the visual
interpretation and unsupervised classification results were able to be compared
with the statistical numbers, which provided a background about each farm's
Search WWH ::

Custom Search