Geography Reference
In-Depth Information
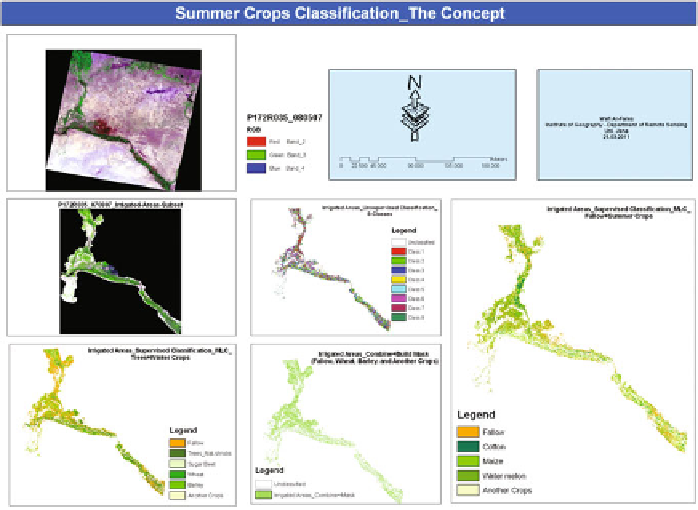
Fig. 5.54 The followed concept to classify the major summer crops based on both the previous
winter crops classification and the generated spatial distribution of the irrigated areas
schematics were available for each project with large drawing scales. Because of
this, I was able to become familiar with every irrigation project included in the
basin and its spatial prevalence on the satellite images. So, I was able to integrate
the spatial distribution with the available statistic numbers of each project in
several time-durations. This was also compatible with the remotely sensed data
about the study area in my possession. These links enabled me to select the
training samples used in the supervised classification and to use them in assess-
ment of the accuracy of the classification. This was, of course, in addition to the
remaining referential data previously mentioned.
As for the other basin areas located outside the borders of the irrigation projects,
since the required classification level is general and not detailed, it was decided it
would be sufficient to count on the remotely sensed data in addition to the the-
matic, topographic and Google Earth maps and during the selecting process of the
training-samples.
Here the problem is that full statistics concerning agrarian activities and types/
classes of plantations were available, but only at a governmental and governorates
level. This meant that the data did not provide information about what had been
previously cultivated. The other problem was that many fields were not planted
every year with the same crop. Detailed information about which specific crops
had been planted in the training-samples was required. This level of detail was
Search WWH ::

Custom Search