Geography Reference
In-Depth Information
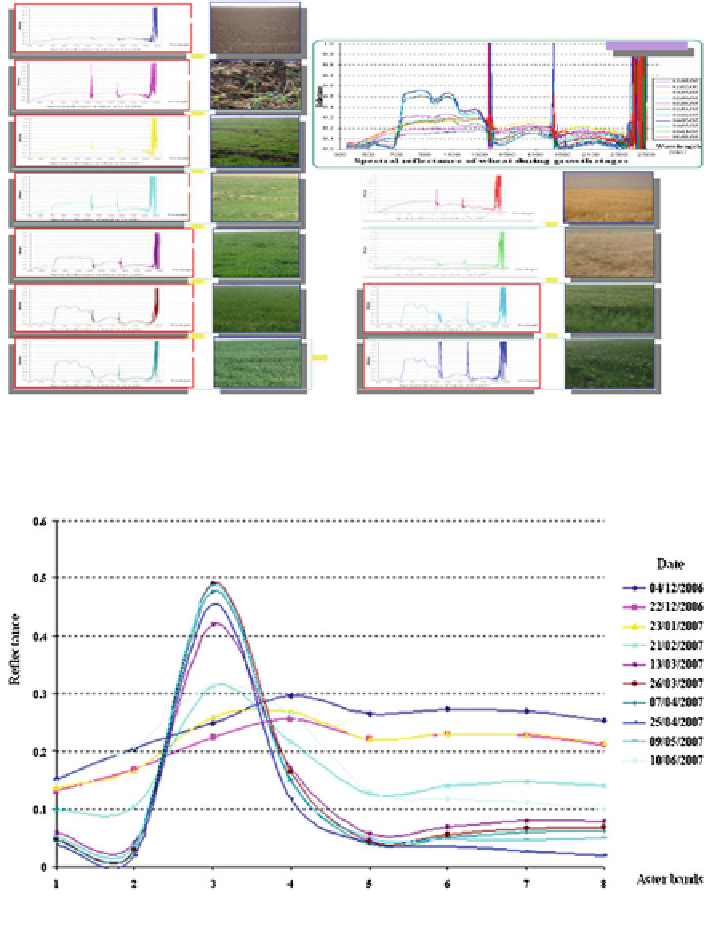
Fig. 5.20
Spectral reflectance measurements for wheat at different growth stages
Fig. 5.21 Spectral reflectance values of irrigated wheat during its growth stages in Arraqqah
using the ASTER-bands
potential to detect the spectral characteristics of the three crops of interest, among
the various growth stages, using the first three ASTER-bands.
Figure
5.25
represents the effect of the vegetation growth stages on the spectral
response of cotton at the third ASTER-band.
Search WWH ::

Custom Search