Geoscience Reference
In-Depth Information
a
b
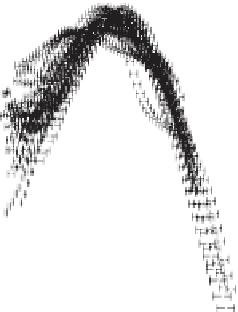
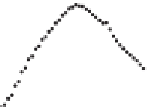
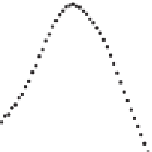
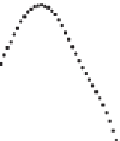
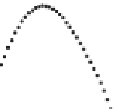
Fig. 3.1 a
Average aerosol size spectrum for each of the 23 data sets (
left
) and total average aero-
sol size spectrum for the 23 data sets (
right
). Error bars indicate one standard deviation on either
side of the mean. Model predicted scale independent aerosol size spectrum also is shown in the
figure.
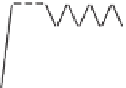
b
Details of (i) mean volume radius nm, (ii) aerosol total number concentration cm
−3
num-


Search WWH ::

Custom Search