Geoscience Reference
In-Depth Information
σ
σ
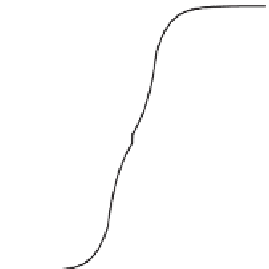
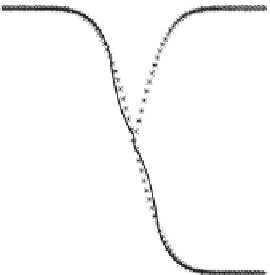
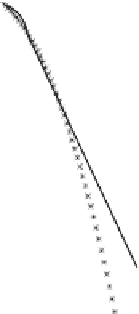
Fig. 1.8
Model predicted probability distribution
P
along with the corresponding statistical nor-
mal distribution with probability values plotted on linear and logarithmic scales, respectively, on
the
left-
and
right
-hand side graphs
The length scale
z
is related to the suspended particulate radius
r
a
(Eq. 1.14). There-
fore,
3
2
r
r
a
as
ln
z
=
ln
.
(1.24)
r
r
a
as
, i.e.,
r
an
represents the suspended par-
ticulate mean volume radius
r
a
in terms of its mean volume radius
r
as
at the surface
(or reference level). Therefore,
Defining a normalized radius
r
an
equal to
=
3
2
ln
z
ln
r
,
(1.25)
an
=
3
2
(1.26)
d
ln
z
d
ln
r
.
an
Substituting for dln
z
in Eq. (1.23)


Search WWH ::

Custom Search