Biology Reference
In-Depth Information
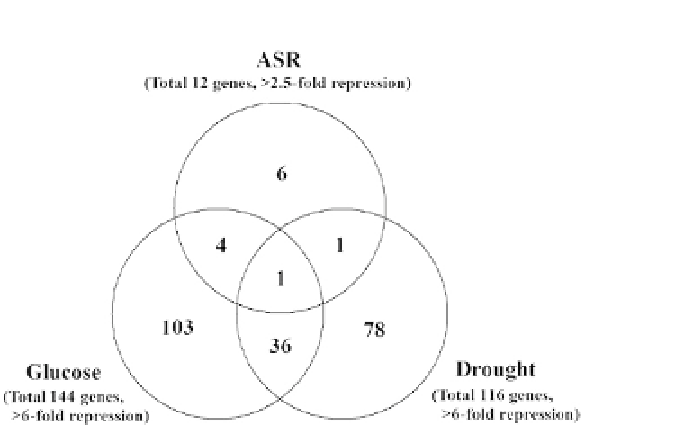
Figure 2.7
Venn diagrams showing the ASR (LLA23)-, glucose-, and drought-downreg-
ulated genes identified basis on microarray analyses. In total, 12 ASR-, 144 glucose-, and
116 drought-repressive genes were identified via the microarray analysis. The genes
identified were grouped into the following seven groups: highly ASR-repressive, highly
glucose-repressive, highly drought-repressive, ASR- and glucose-repressive genes, ASR-
and drought-repressive genes, glucose- and drought-repressive genes, and ASR-, glu-
cose-, and drought-repressive genes. The number of genes with a more than two and
halffold change in expression ratio in
35S::LLA23
plants or a sixfold change in expression
ratio in the glucose and drought treatments is indicated.
and halffold change in expression ratio in the LLA23-overexpressing treat-
ment, 37 genes such as Rubisco activase, Rubisco subunit-binding proteins,
plastocyanin, phytocyanin, and components of photosystems I and II, were
downregulated. These results are consistent with a previous report that indi-
cated that water stress inhibits photosynthesis (
Seki et al., 2002
;
Tezara et al.,
1999
). For glucose and/or drought-stress treatment, transcription factors and
signaling genes consist of 20% of downregulated genes in stressed plants.
Functional proteins, such as detoxification enzymes, transporters, enzymes
for osmoprotectant synthesis, cell wall-related, stress- and defense-related
proteins, were also significantly repressed. We observed that the expression
of some stress-responsive genes in wild-type plants is upregulated, whereas
some are downregulated. Although the apparent inconsistencies in stress
responsiveness are not easily explained, they are not without precedent (
Kang
et al., 2002
;
Seki et al., 2002
;
Price et al., 2004
). Interestingly, auxin-induced
protein (At1g29500, At1g29510 and At1g04250), zeaxanthin epoxidase pre-
cursor (At5g67030) for ABA biosynthesis, and gibberellin-regulated protein
(At1g22690) genes were also identified (
Table 2.5
), suggesting a link between
auxin, ABA, gibberellins, and signaling pathways of sugar or drought stress.
Search WWH ::

Custom Search