Geology Reference
In-Depth Information
0
Post-depositional
Production
A
Inheritance
(-)
exponential
integrates across
bioturbation
biotur-
bation
0
(+)
10
Be Profile
Dating Metho
d
0.5
10
Be Profiles on
Bioturbated Terraces
1
post-depositional
grow-in
1.5
Estimated
concentration
due to inheritance
plus exposure
inheritance
(from littoral sand)
2
H
Concentration of
10
Be
2.5
0
B
10
Be age, ignorin
g
inheritance: ~26 ka
10
Be age, accounting
for inheritance: ~15 ka
3
50
0.0
0.10
0.20
0.30
0.40
0.50
0.60
0.70
10
Be Concentration (Matoms/g qtz)
100
Fig. 3.18
Use of cosmogenic radionuclide
concentration profile to deduce both inheritance
and surface age.
Dated surface is the Stockton bar of Lake Bonneville,
associated with the latest highstand of the lake, at
roughly 14.5 ka. Grayed box represents the concentra-
tion due to inheritance of cosmogenic radionuclides by
the quartzite clasts prior to deposition in the bar. Best-fit
line is exponential shifted to account for inheritance.
Age deduced from this method is 15 ka. If inheritance
were not accounted for, and a single surface sample
were used to deduce age, the estimated age would have
been
∼
26 ka, too old by roughly 11 ka.
zone of
bioturbation
150
200
T 5
T 4
T 3
T 2
T 1
250
300
Santa Cruz
Marine Terraces
350
0
2
4
6
8
10
Concentration of
10
Be (
10
5
atoms/g)
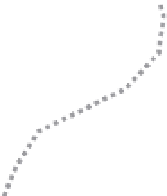
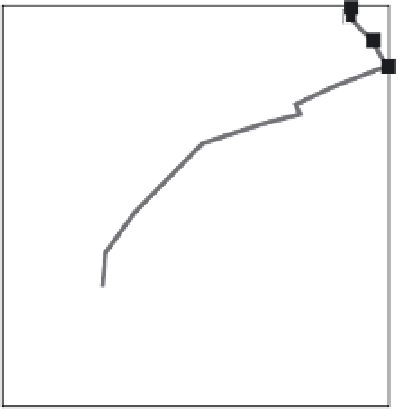
Fig. 3.19
10
Be ages of bioturbated terraces.
A. Schematic profile of
10
Be developed in a marine
terrace in the face of bioturbation of the topmost
portion of the profile. The expected exponential curve
of
10
Be concentration due to inheritance plus
in situ
production is blunted by this mixing. The integral of the
post-depositional inventory of nuclides remains a
faithful clock and can be used to date the terrace,
because the total
10
Be inventory is unchanged, despite
being redistributed by bioturbation. B. Examples of
10
Be profiles in five marine terraces near Santa Cruz,
California. Lines connect measurement points on only
the first, third, and fifth terraces. Each profile is blunted
and shifted laterally by a different amount due to
contrasts in the amount of inheritance, but the integral
of the post-depositional portion of the inventory still
increases monotonically with height of the terrace
above sea level and, hence, with age. Modified after
Perg
et al
. (2001).
carrying cosmogenic radionuclides. The resulting
profile of
10
Be concentrations, for example, should
therefore be blunted near the top. Whereas this
mixing negates the possibility of fitting an expo-
nential through the profile in order to deduce the
component of post-depositional accumulation of
nuclides, it has been shown that one can use
instead the integral of the profile as a clock: as
long as the inheritance can be constrained by
deep samples, the age of the surface can still be
obtained. This method was successfully employed
on California's Santa Cruz marine terraces (Perg
et al.
, 2001), resulting in ages for each of the five
major terraces that tell a story of roughly steady
1 mm/yr rock uplift of the coast over the last few
hundred thousand years (Fig. 3.19).