Geology Reference
In-Depth Information
modern sea level
0
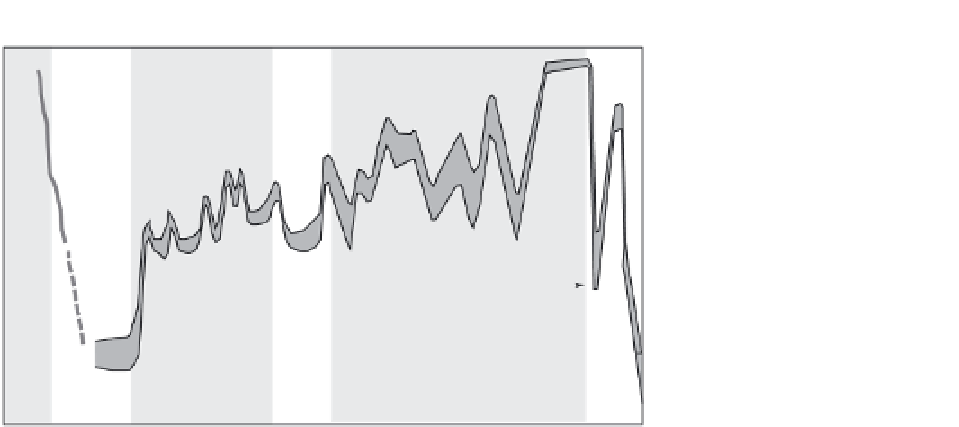
Sea-Level
Curve
-50
Fig. 2.5
Variations in real
sea level since 140 ka.
Sea-level variations as
reconstructed from coastal
terraces and sediments on
continental shelves. Note the
1-20 m changes at frequencies
of a few thousand years.
Modified from Lambeck and
Chappell (2001).
last interglaciation
-100
Stg.
1
Stage
4
Stg.
6
Stage 5
Stage 2
Stage 3
-150
0
20
40 60
1000s of years before present
80
100
120
140
is presently 131 m above sea level (this is its
relative sea-level position), it can be assumed to
have formed during the last interglacial
maximum sea level of +6 m. The tectonic uplift
is consequently 125 m (131 m − 6 m), and the
average uplift rate is 1 m/kyr (125 m/125 kyr).
The rate of apparent sea-level change is,
therefore, −1 m/kyr. Either the graphical or
the arithmetic subtraction of the magnitude of
the apparent sea level from the elevation of the
correlative, dated terrace yields the real sea-level
change through time (Fig. 2.4):
the oxygen isotopic record. Comparison of the
sea-level curve for the past 135 ka (Fig. 2.5) with
the oxygen isotopic curve (see Fig. 2.3) shows that
they are clearly similar, but the magnitude of
successive peaks varies considerably. Hence, our
knowledge of sea levels prior to 135 ka should be
regarded as only approximate. Moreover, recent
studies show that high-resolution records of
sea-level change are commonly valid only at local
or regional scales (Milne and Mitrovica, 2008).
Although the overall pattern, timing, and general
magnitude of sea-level change are likely to be
correct, complex deformation of the geoid by
changing loads and mantle processes dictates that
few places on Earth will faithfully record past
eustastic changes at better than ±5 m. Despite
these caveats, along many tectonically active
coastlines, flights of marine terraces provide a
very powerful tool for calibrating absolute and
differential uplift and tilting all along the coast.
Eustatic sea level has not varied much during
the past several thousand years. As a conse-
quence, well-developed abrasion platforms
(Plate 1A) and coral terraces exist along many
coastlines. In addition, several features with a
much more limited preservation potential can
provide useful markers for delineating Holocene
deformation. Along stony beaches during major
storms, gravelly beach ridges and berms are
formed a few meters above the typical high-tide
line (Stevens, 1974). Because the crests of these
features are parallel to the sea surface, they
real = relative − apparent
Over the past few decades, a major effort has
been made to create a reliable curve of “real” sea-
level change. Field studies have focused primarily
on coral terraces and deposits on shallow
continental shelves, and have yielded a curve that
is considered to be quite well known for the past
135 ka, especially for the highstands (Fig. 2.5),
but is less confidently defined before that time.
The uncertainty arises in part from imprecision
in dates of older terraces and in part from the
paucity of reliable sea-level calibration points
that are older than 135 kyr. It is questionable
whether tectonic uplift rates defined for more
recent intervals can be confidently extrapolated
into the past, so that apparent sea-level changes
are difficult to define at longer time scales. As a
consequence, the sea-level curve prior to 135 ka is
often closely modeled on the variations shown by